Spreadsheets are a great lightweight databases. Google Spreadsheets in particular are easy to work with and share, making this unlike most traditional database setups. That being said, traditional databases are great for bigger, more secure jobs. If you're storing lots and lots and lots of information, or storing sensitive or complex information -- the spreadsheet is not for you. But if you're working on small to medium sized personal or community projects, try a spreadsheet!
- Link to Sheetsee.js, tabletop.js and jQuery in your HTML head.
- Create a place holder
<div>in your HTML for any chart, map or table you want to have. - Create templates for tables in
<script>tags. - Inside of a
<script>tag initialize Tabletop.js. It waits for the document to load and then initializes tabletop and calls back a function when it has returned with the spreadsheet data.
document.addEventListener('DOMContentLoaded', function() {
    var gData
    var URL = "YOURSPREADSHEETSKEYHERE"
    Tabletop.init( { key: URL, callback: callback, simpleSheet: true } )
})- Define the function that Tabletop.js calls when it returns with the data. This function will contain all the Sheetsee.js functions that you use for the maps, charts and tables you desire. Style it up with some CSS.
function callback(data) {
    // All the sheetsee things you want to do!
}- Set it and forget. Now all you need to do is edit the spreadsheet and visitors will get the latest information every time they load the page.
Ignoring some HTML things to conserve space, you get the point. This is a basic setup.
<html>
  <head>
    <meta charset="utf-8">
    <script type="text/javascript" src="//ajax.googleapis.com/ajax/libs/jquery/2.0.3/jquery.min.js"></script>
    <script type="text/javascript" src="js/tabletop.js"></script>
    <script type="text/javascript" src='js/sheetsee.js'></script>
    <link rel="stylesheet" type="text/css" href="css/sss.css">
  </head>
  <body>
  <div id="placeholder"></div>

  <script id="placeholder" type="text/html">
    // template if you so desire!
  </script>

  <script type="text/javascript">
    document.addEventListener('DOMContentLoaded', function() {
        var URL = "YOURSPREADSHEETSKEYHERE"
        Tabletop.init( { key: URL, callback: myData, simpleSheet: true } )
    })
    function myData(data) {
        All the sheetsee things you want to do!
    }
  </script>
  </body>
</html>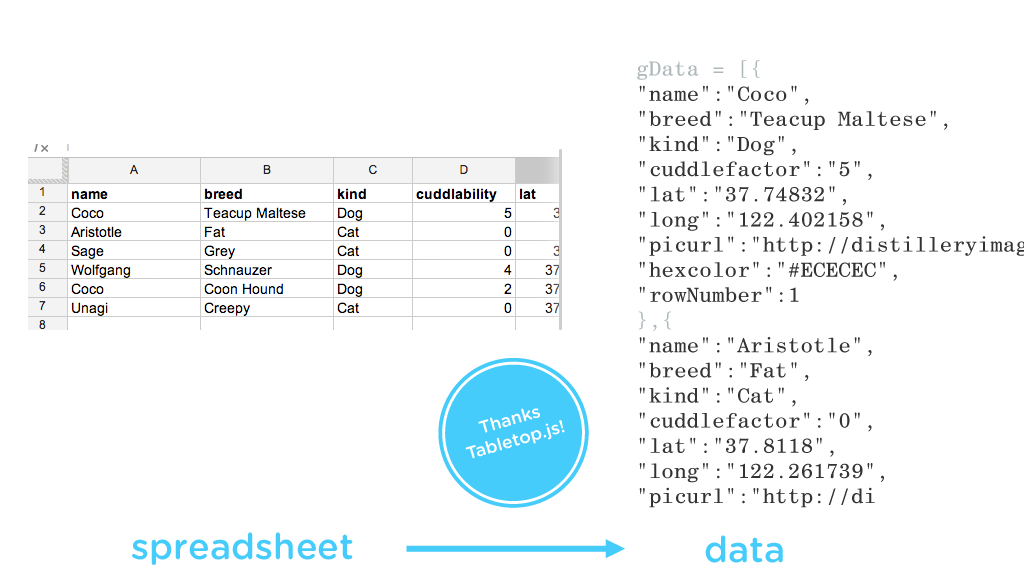
Your Google Spreadsheet should be set up with row one as your column headers. Row two and beyond should be your data. Each header and row becomes an oject in the final array that Tabletop.js delivers of your data.
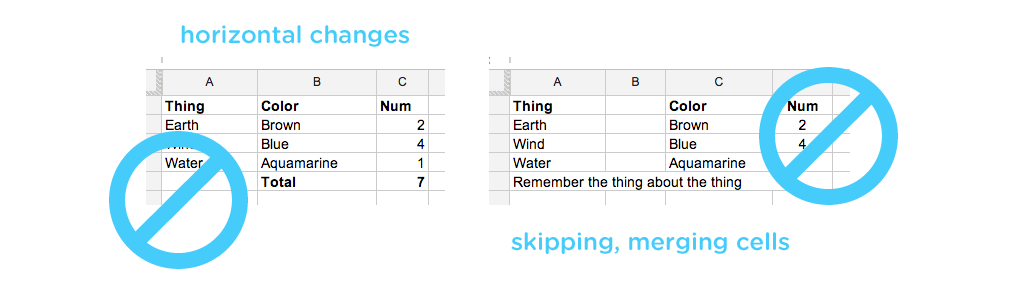
There shouldn't be any breaks or horizontal organization in the spreadsheet. But, feel free to format the style of your spreadsheet as you wish; borders, fonts and colors and such do not transfer or affect your data exporting.
[{"name":"Coco","breed":"Teacup Maltese","kind":"Dog","cuddlability":"5","lat":"37.74832","long":"-122.402158","picurl":"http://distilleryimage8.s3.amazonaws.com/98580826813011e2bbe622000a9f1270_7.jpg","hexcolor":"#ECECEC","rowNumber":1}...]
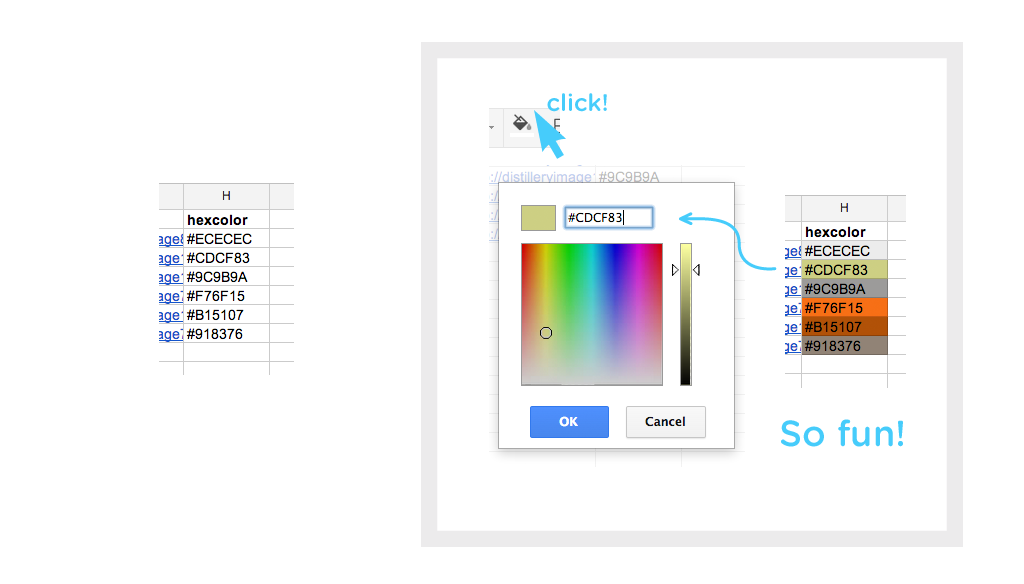
You must add a column to your spreadsheet with the heading hexcolor (case insensitive). The maps, charts and such use colors and this is the easiest way to standardize that. The color scheme is up to you, all you need to do is fill the column with hexidecimal color values. This color picker by Devin Hunt is really nice. #Funtip: Coloring the background of the cell it's hexcolor brings delight!
If you intend to map your data and only have addresses you'll need to geocode the addresses into lat/long coordinates. Mapbox built a plugin that does this for you in Google Docs. You can also use websites like latlong.net to get the coordinates and paste them into rows with column headers lat and long.
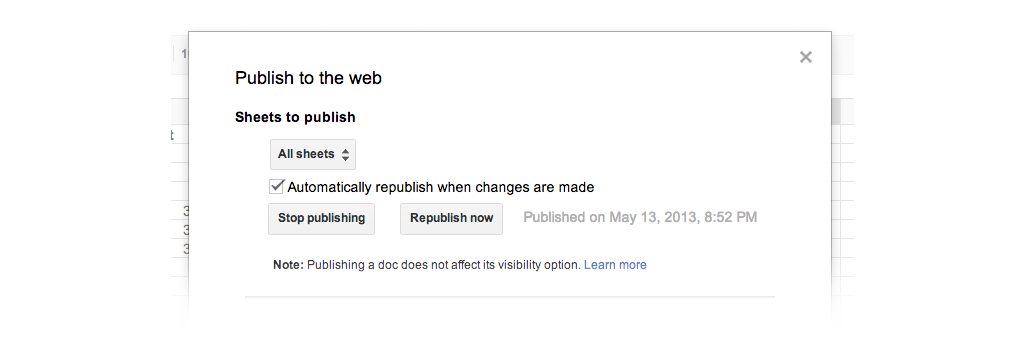
You need to do this in order to generate a unique key for your spreadsheet, which Tabletop.js will use to get your spreadsheet data. In your Google Spreadsheet, click File > Publish to the Web. Then in the next window click Start Publishing; it will then turn into a Stop Publishing button.

You should have an address in a box at the bottom, your key is the portion between the = and the &. You'll retrieve this later when you hook up your site to the spreadsheet. Actually, you technically can use the whole URL, but it's so long...
Sheetsee.js comes with a bare minimum stylesheet, sss.css, which contains elements you'll want to style when using the feature they correspond to.