You signed in with another tab or window. Reload to refresh your session.You signed out in another tab or window. Reload to refresh your session.You switched accounts on another tab or window. Reload to refresh your session.Dismiss alert
I was adding a multiline chart to my app using LineChartView, the same code as example code in LineChart2ViewController. The only different thing from the example is datasets has different x values.
What did you expect to happen?
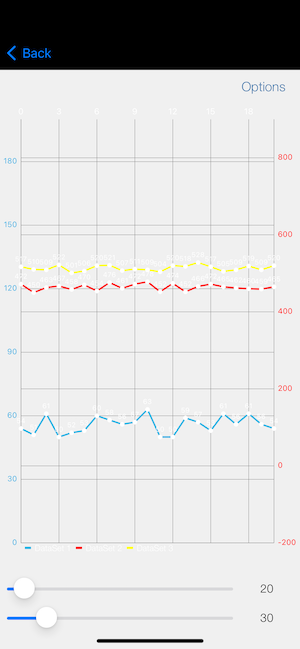
The chart show multilines with different x values.
What happened instead?
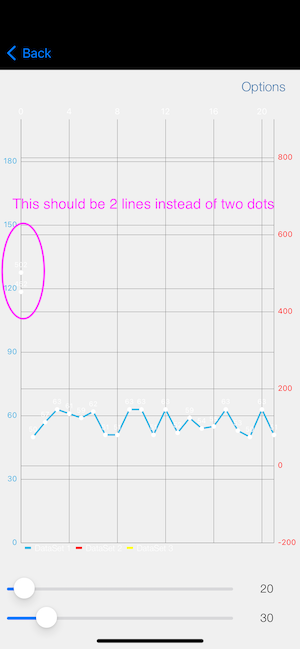
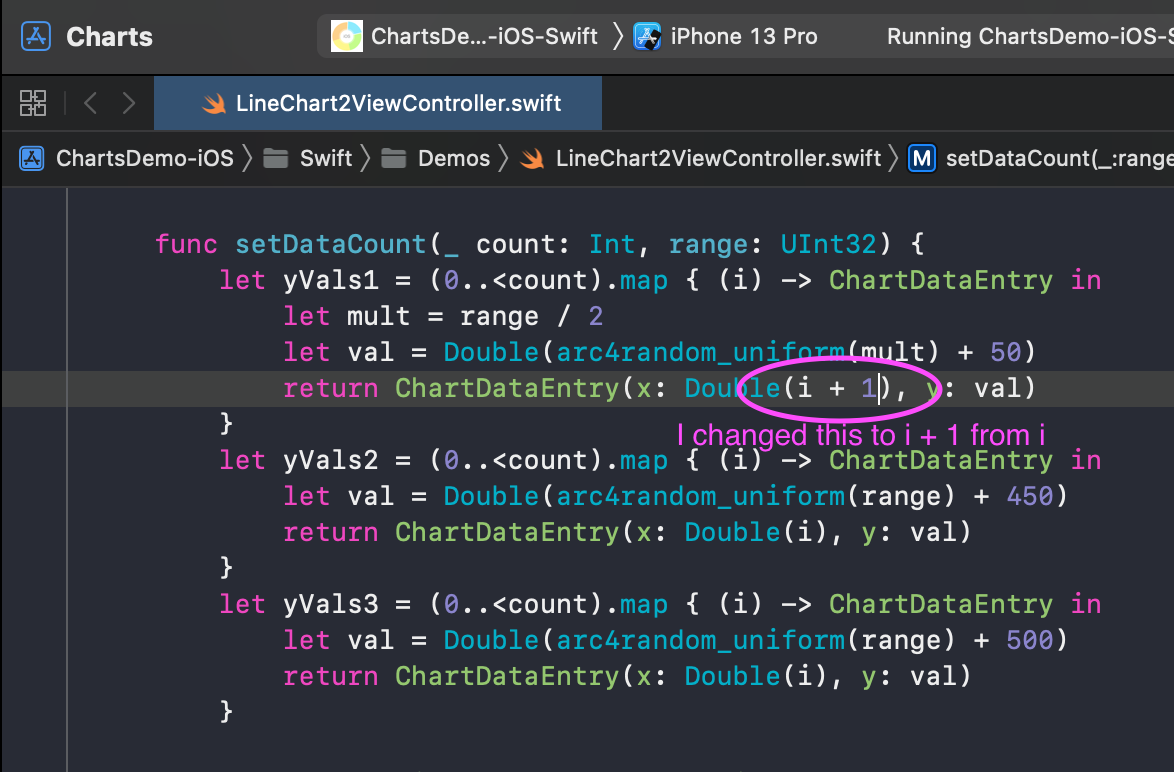
Only one line showed, the other lines just show dots. You can reproduce it by update line 96 in the file LineChart2ViewController.swift in the example project, change to i + 1 from i. return ChartDataEntry(x: Double(i + 1), y: val)
Charts Environment
Charts version/Branch/Commit Number: 4.0.3/master/b38b8d45a8cbda9f0f2a3566778ed114f06056b7 Xcode version: 13.2.1 Swift version: 5.5.2 Platform(s) running Charts: iOS macOS version running Xcode: 11.5.2
Demo Project
The demo project is the example project of this library. The only thing I changed is line 96 in the file LineChart2ViewController.swift, to make x value of data set 1 different to the other two data sets. Please build the project, tap Line Chart (Dual YAxis) to see the problem. https://drive.google.com/file/d/1AX-0QbQt8ro_joP2iiDGPksXaWA-l4JI/view?usp=sharing
Screenshots
What I expected:
What it happened:
What I did:
The text was updated successfully, but these errors were encountered:
We have seen this issue too and it is the main reason for us to keep using version 3.6.0 until this Is fixed.
I've determined the linegraphs are calculating some Bounds object which ends up with an internal endpoint of nil and thus returns a range of min = 0, max = 0 and a range of 0 so only the first point gets drawn
What did you do?
I was adding a multiline chart to my app using
LineChartView, the same code as example code inLineChart2ViewController. The only different thing from the example is datasets has different x values.What did you expect to happen?
The chart show multilines with different x values.
What happened instead?
Only one line showed, the other lines just show dots. You can reproduce it by update line 96 in the file LineChart2ViewController.swift in the example project, change to
i + 1fromi.return ChartDataEntry(x: Double(i + 1), y: val)Charts Environment
Charts version/Branch/Commit Number: 4.0.3/master/b38b8d45a8cbda9f0f2a3566778ed114f06056b7
Xcode version: 13.2.1
Swift version: 5.5.2
Platform(s) running Charts: iOS
macOS version running Xcode: 11.5.2
Demo Project
The demo project is the example project of this library. The only thing I changed is line 96 in the file LineChart2ViewController.swift, to make x value of data set 1 different to the other two data sets. Please build the project, tap Line Chart (Dual YAxis) to see the problem.
https://drive.google.com/file/d/1AX-0QbQt8ro_joP2iiDGPksXaWA-l4JI/view?usp=sharing
Screenshots
What I expected:


What it happened:
What I did:
The text was updated successfully, but these errors were encountered: