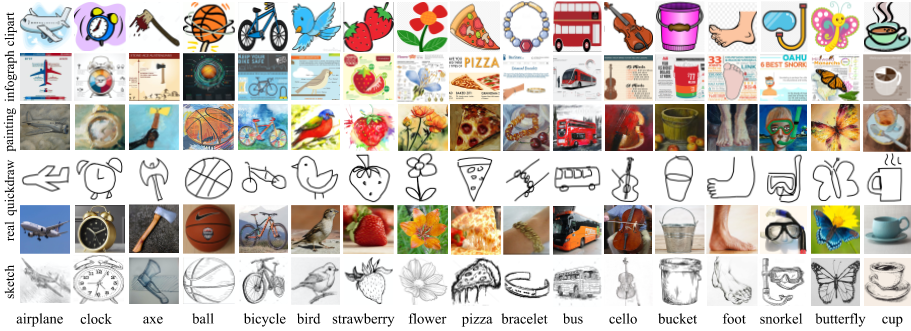
The multi-source domain adaptation challenge uses DomainNet as the testbed. DomainNet dataset is collected to study the transfer learning task. It contains approximately 0.6 million images, distributed among 345 categories. There are four distinct domains:
- Clipart (clp), a collection of clipart images;
- Infograph (inf), infographic images with specific object;
- Painting (pnt), artistic depictions of object in the form of paintings;
- Quickdraw (qdr), drawings from the worldwide players of game “Quick Draw!”;
- Real (rel), photos and real world images;
- Sketch (skt), sketches of specific objects.
It is very large-scale and includes rich informative vision cues across different domains, providing a good testbed for multi-source domain adaptation.
In this multi-source domain adaptation challenge, we will utilize Infograph, Quickdraw, and Real as the training domains, Sketch as the validation domain, and Clipart and Painting as the test domain.
By downloading these datasets you agree to the following terms:
- You will use the data only for non-commercial research and educational purposes.
- You will NOT distribute the images.
- The organizers make no representations or warranties regarding the data, including but not limited to warranties of non-infringement or fitness for a particular purpose.
- You accept full responsibility for your use of the data.
You can download the datasets with the following link:
Train/val images are structured in folders as
{split}/{category}/{object_id}.jpg/png
For the training domains and validation domain, we will provide train.txt and test.txt to indicate the training trunk and testing trunk.
Ideally, you should train two identical models with the same strategy/approach/hyperparameter on following settings:
Model I: Train on labeled images in sketch_train.txt (#49,115) /real_train.txt (#122,563) /quickdraw_train.txt (#120,750) /infograph_train.txt (#37,087) + unlabeled images in clipart_train.txt (#34,019), Test on unlabeled images in clipart_test.txt (#14,814).
Model II: Train on labeled images in sketch_train.txt (#49,115) /real_train.txt (#122,563) /quickdraw_train.txt (#120,750) /infograph_train.txt (#37,087) + unlabeled images in painting_train.txt (#52,867), Test on unlabeled images in painting_test.txt (#22,892).
The submission file should contain the predictions of model I on 14,814 testing images and the predictions of model II on 22,892 testing images. The final ranking will be determined by how many correct predictions do the submission file have within the (14,814+22,892) images. One submission example can be found with the following link: https://github.com/VisionLearningGroup/visda-2019-public/blob/master/multisource/submission_example/result.txt
To evaluate the performance of your adaptation model, you should:
- Train your model with training data (with labels) and adapt it on the validation data (without labels).
- Predict labels for images in the validation set. The results file should follow the format of one category ID prediction per line, in the order of images provided by submission_list.txt. Please see a sample submission file here.
- Calculate the mean accuracies for each category and the overall mean of these accuracies. We have provided the evaluation script used by our server (eval.py) so that you may evaluate your results offline. You are encouraged to upload your results to the evaluation server to compare your performance with that of other participants.
Submissions will be evaluated by calculating the classification accuracy of each category and then the mean accuracy across all categories (i.e. known and unknown). The leaderboard on CodaLab will display all of these scores, and the official ranking will be determined by the mean classification accuracy across all categories.
We are using CodaLab to evaluate results and host the leaderboards for this challenge. You can find the image classification competition here. There are two competition leaderboards: the main leaderboard shows results of adapted models and will be used to determine the final team ranks. The expanded leaderboard additionally shows the team's source-only models, i.e. those trained only on the source domain without any adaptation. These results are useful for estimating how much the method improves upon its source-only model, but will not be used to determine team ranks.
Once the servers become available, you will be able to submit your results:
- Generate "result.txt"
- Place the result file into a zip file named [team_name]_submission
- Submit to the CodaLab evaluation server following the instructions below
To submit your zipped result file to the appropriate VisDA challenge click on the “Participate” tab. Select the phase (validation or testing). Select “Submit / View Results, fill in the required fields and click “Submit”. A pop-up will prompt you to select the results zip file for upload. After the file is uploaded, the evaluation server will begin processing. This might take some time. To view the status of your submission please select “Refresh Status”. If the status of your submission is “Failed” please check your file is named correctly and has the right format. You may refer to the scoring output and error logs for more details.
After you submit your results to the evaluation server, you can control whether your results are publicly posted to the CodaLab leaderboard. To toggle the public visibility of your results please select either “post to leaderboard” or “remove from leaderboard.”
If you find any bugs please open an issue.

