Skip to content
New issue

Have a question about this project? Sign up for a free GitHub account to open an issue and contact its maintainers and the community.

By clicking “Sign up for GitHub”, you agree to our terms of service and privacy statement. We’ll occasionally send you account related emails.

Already on GitHub? Sign in to your account

Add tutorial for injecting chaos using LitmusChaos and observing chaos with OpenTelemetry #4858

Open
wants to merge 4 commits into
base: master
Choose a base branch
from

Conversation

suhyenim
Copy link
Contributor

@suhyenim suhyenim commented Sep 1, 2024

Proposed changes

This PR is about a tutorial that provides a step-by-step guide for injecting chaos into target applications using LitmusChaos and observing the chaos with OpenTelemetry. The target application, Otel-demo, consists of microservices written in various programming languages that communicate over gRPC and HTTP, along with a load generator that uses Locust to simulate user traffic. By following this tutorial, users can gain insights of observability and deepen their understanding of chaos engineering.

Tutorial Architecture

otel-demo-tutorial-architecture

Tutorial Summary

  1. Install litmus & Set up environments → Detail
  2. Install target applications (otel-demo) → Detail
  3. Install OpenTelemetry, Prometheus, Jaeger, Grafana → Detail
  4. Set up probe & Perform chaos experiments
    • Experiment 1: pod-network-latency on cart service → Detail
      • This experiment is designed to fail.
    • Experiment 2: pod-delete on recommendation service → Detail
      • This experiment is designed to pass.
  5. Observe chaos on Grafana
    • Experiment 1: pod-network-latency on cart service
      • Users can check cart service Spanmetrics Metrics.
        cartservice-spanmetrics
      • Also, users can check the chaos experiment results.
        cartservice-spanmetrics
    • Experiment 2: pod-delete on recommendation service
      • Users can check Error Rate in frontend service Spanmetrics.
        frontend-spanmetrics
      • Also, users can check the chaos experiment results.
        cartservice-spanmetrics

Types of changes

What types of changes does your code introduce to Litmus? Put an x in the boxes that apply

  • New feature (non-breaking change which adds functionality)
  • Bugfix (non-breaking change which fixes an issue)
  • Breaking change (fix or feature that would cause existing functionality to not work as expected)
  • Documentation Update (if none of the other choices applies)

Checklist

Put an x in the boxes that apply. You can also fill these out after creating the PR. If you're unsure about any of them, don't hesitate to ask. We're here to help! This is simply a reminder of what we are going to look for before merging your code.

  • I have read the CONTRIBUTING doc
  • I have signed the commit for DCO to be passed.
  • Lint and unit tests pass locally with my changes
  • I have added tests that prove my fix is effective or that my feature works (if appropriate)
  • I have added necessary documentation (if appropriate)

Dependency

This PR does not introduce any new dependencies.

Special notes for your reviewer:

Co-authored-by: Suhyen Im <[email protected]>
Co-authored-by: Jaeyeon Park <[email protected]>
Signed-off-by: Suhyen Im <[email protected]>
Signed-off-by: Jaeyeon Park <[email protected]>
Co-authored-by: Suhyen Im <[email protected]>
Co-authored-by: Jaeyeon Park <[email protected]>
Signed-off-by: Suhyen Im <[email protected]>
Signed-off-by: Jaeyeon Park <[email protected]>
@moggaa
Copy link

moggaa commented Sep 4, 2024

We have added more details to the PR description and included tutorial screenshots. Could you please review or check it?

@namkyu1999
Copy link
Member

namkyu1999 commented Sep 6, 2024

Run dorny/paths-filter@v3 pipeline failed because the paths-filter does not watch these changes paths. We can still review and merge this PR because this failure is not a fault.

@suhyenim suhyenim changed the title feat: add otel-demo tutorial Add tutorial for injecting chaos using LitmusChaos and observing with OpenTelemetry Sep 27, 2024
@suhyenim suhyenim changed the title Add tutorial for injecting chaos using LitmusChaos and observing with OpenTelemetry Add tutorial for injecting chaos using LitmusChaos and observing chaos with OpenTelemetry Sep 27, 2024
Co-authored-by: Suhyen Im <[email protected]>
Co-authored-by: Jaeyeon Park <[email protected]>
Signed-off-by: Suhyen Im <[email protected]>
Signed-off-by: Jaeyeon Park <[email protected]>
@suhyenim
Copy link
Contributor Author

suhyenim commented Sep 27, 2024

I provide more detailed explanation of this tutorial.


How was the architecture of this tutorial designed?

OpenTelemetry offers a demo that can install both a microservice called the Astronomy Shop, which is configured to extract telemetry data, and OpenTelemetry Collector which are set up to collect and expose this telemetry data. You can explore the demo in more detail via this link.
Thus, the primary focus of this PR is to inject chaos into the cart and recommendation microservices of the Astronomy Shop and then observe the results of these experiments. To be simply, we just added LitmusChaos to the demo that OpenTelemetry already provided.


How is the telemetry data instrumented in this tutorial?

The following instrumentation method diagram provides a detailed explanation of how telemetry data is instrumented in each microservice of the Astronomy Shop. Also, you can check the coverage of logs, metrics, and traces for each microservice of the Astronomy Shop through log coverage link, metric coverage link, and trace coverage link.

Instrumentation method diagram for each microservice
Service Language Description Instrumentation
accountingservice .NET Processes incoming orders and count the sum of all orders (mock/). Automatic Instrumentation
adservice Java Provides text ads based on given context words. Automatic Instrumentation, Manual Instrumentation
cartservice .NET Stores the items in the user’s shopping cart in Redis and retrieves it. Instrumentation Libraries, Manual Instrumentation
checkoutservice Go Retrieves user cart, prepares order and orchestrates the payment, shipping and the email notification. Instrumentation Libraries, Manual Instrumentation
currencyservice C++ Converts one money amount to another currency. Uses real values fetched from European Central Bank. It’s the highest QPS service. Manual Instrumentation
emailservice Ruby Sends users an order confirmation email (mock/). Instrumentation Libraries, Manual Instrumentation
frauddetectionservice Kotlin Analyzes incoming orders and detects fraud attempts (mock/). Instrumentation Libraries
frontend JavaScript Exposes an HTTP server to serve the website. Does not require sign up / login and generates session IDs for all users automatically. Instrumentation Libraries, Manual Instrumentation
paymentservice JavaScript Charges the given credit card info (mock/) with the given amount and returns a transaction ID. Manual Instrumentation
productcatalogservice Go Provides the list of products from a JSON file and ability to search products and get individual products. Instrumentation Libraries, Manual Instrumentation
quoteservice PHP Calculates the shipping costs, based on the number of items to be shipped. Instrumentation Libraries, Manual Instrumentation
recommendationservice Python Recommends other products based on what’s given in the cart. Automatic Instrumentation, Manual Instrumentation
shippingservice Rust Gives shipping cost estimates based on the shopping cart. Ships items to the given address (mock/). Instrumentation Libraries, Manual Instrumentation

How does OpenTelemetry Collector collect and expose telemetry data in this tutorial?

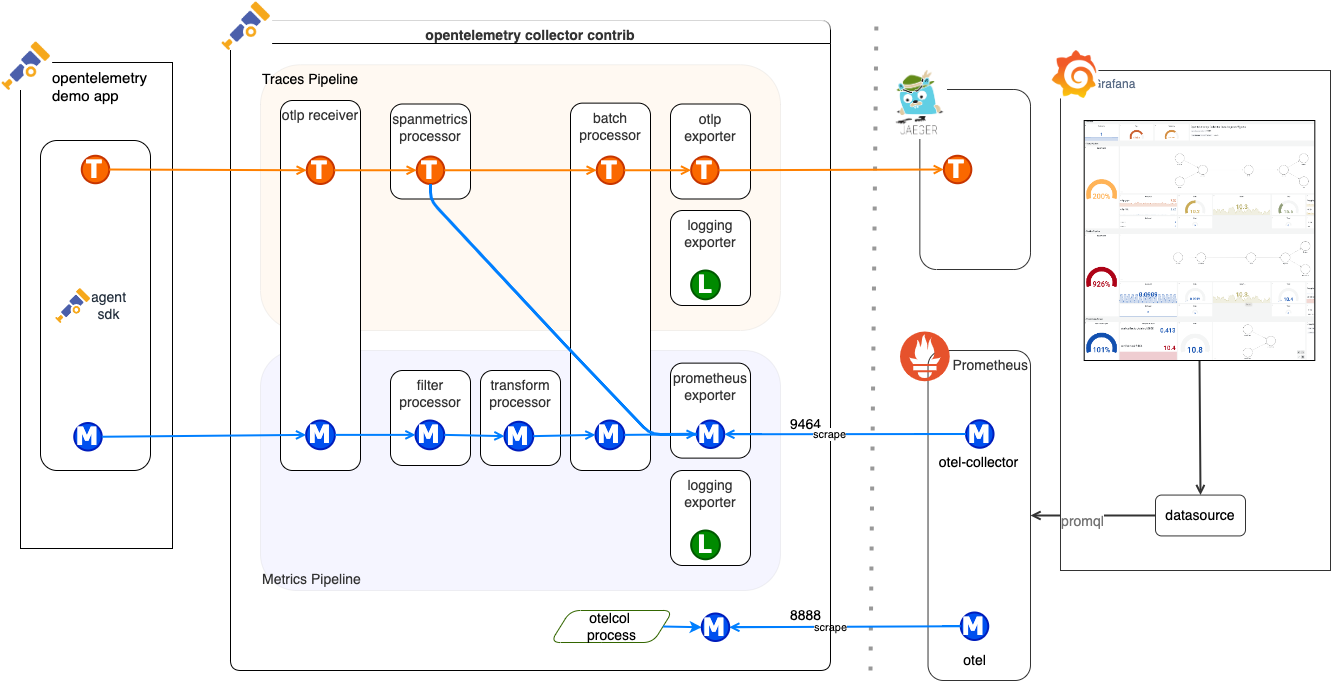
In this tutorial, telemetry data is collected by OpenTelemetry and stored in the Jaeger & Prometheus Backend according to the following data flow diagram.

image.png
In more detail, this OpenTelemetry Collector uses the OTLP Receiver, Prometheus Receiver, HTTPCheck/FrontendProxy Receiver, and Redis Receiver as receivers. Especially, the Prometheus Receiver is collecting chaos metrics exposed through the chaos exporter.
If you are also interested in the configurations for the exporters and processors of the OpenTelemetry Collector, you can refer to this code.

Lastly, I fully support the documentation for this tutorial. :)

Sign up for free to join this conversation on GitHub. Already have an account? Sign in to comment
Projects
Status: In Review
Development

Successfully merging this pull request may close these issues.

3 participants