Round 8 focuses on waning immunity.
Interpretation: These scenarios illustrate a gradual decay of immune protection with time, rather than the impact of an immune escape variant.
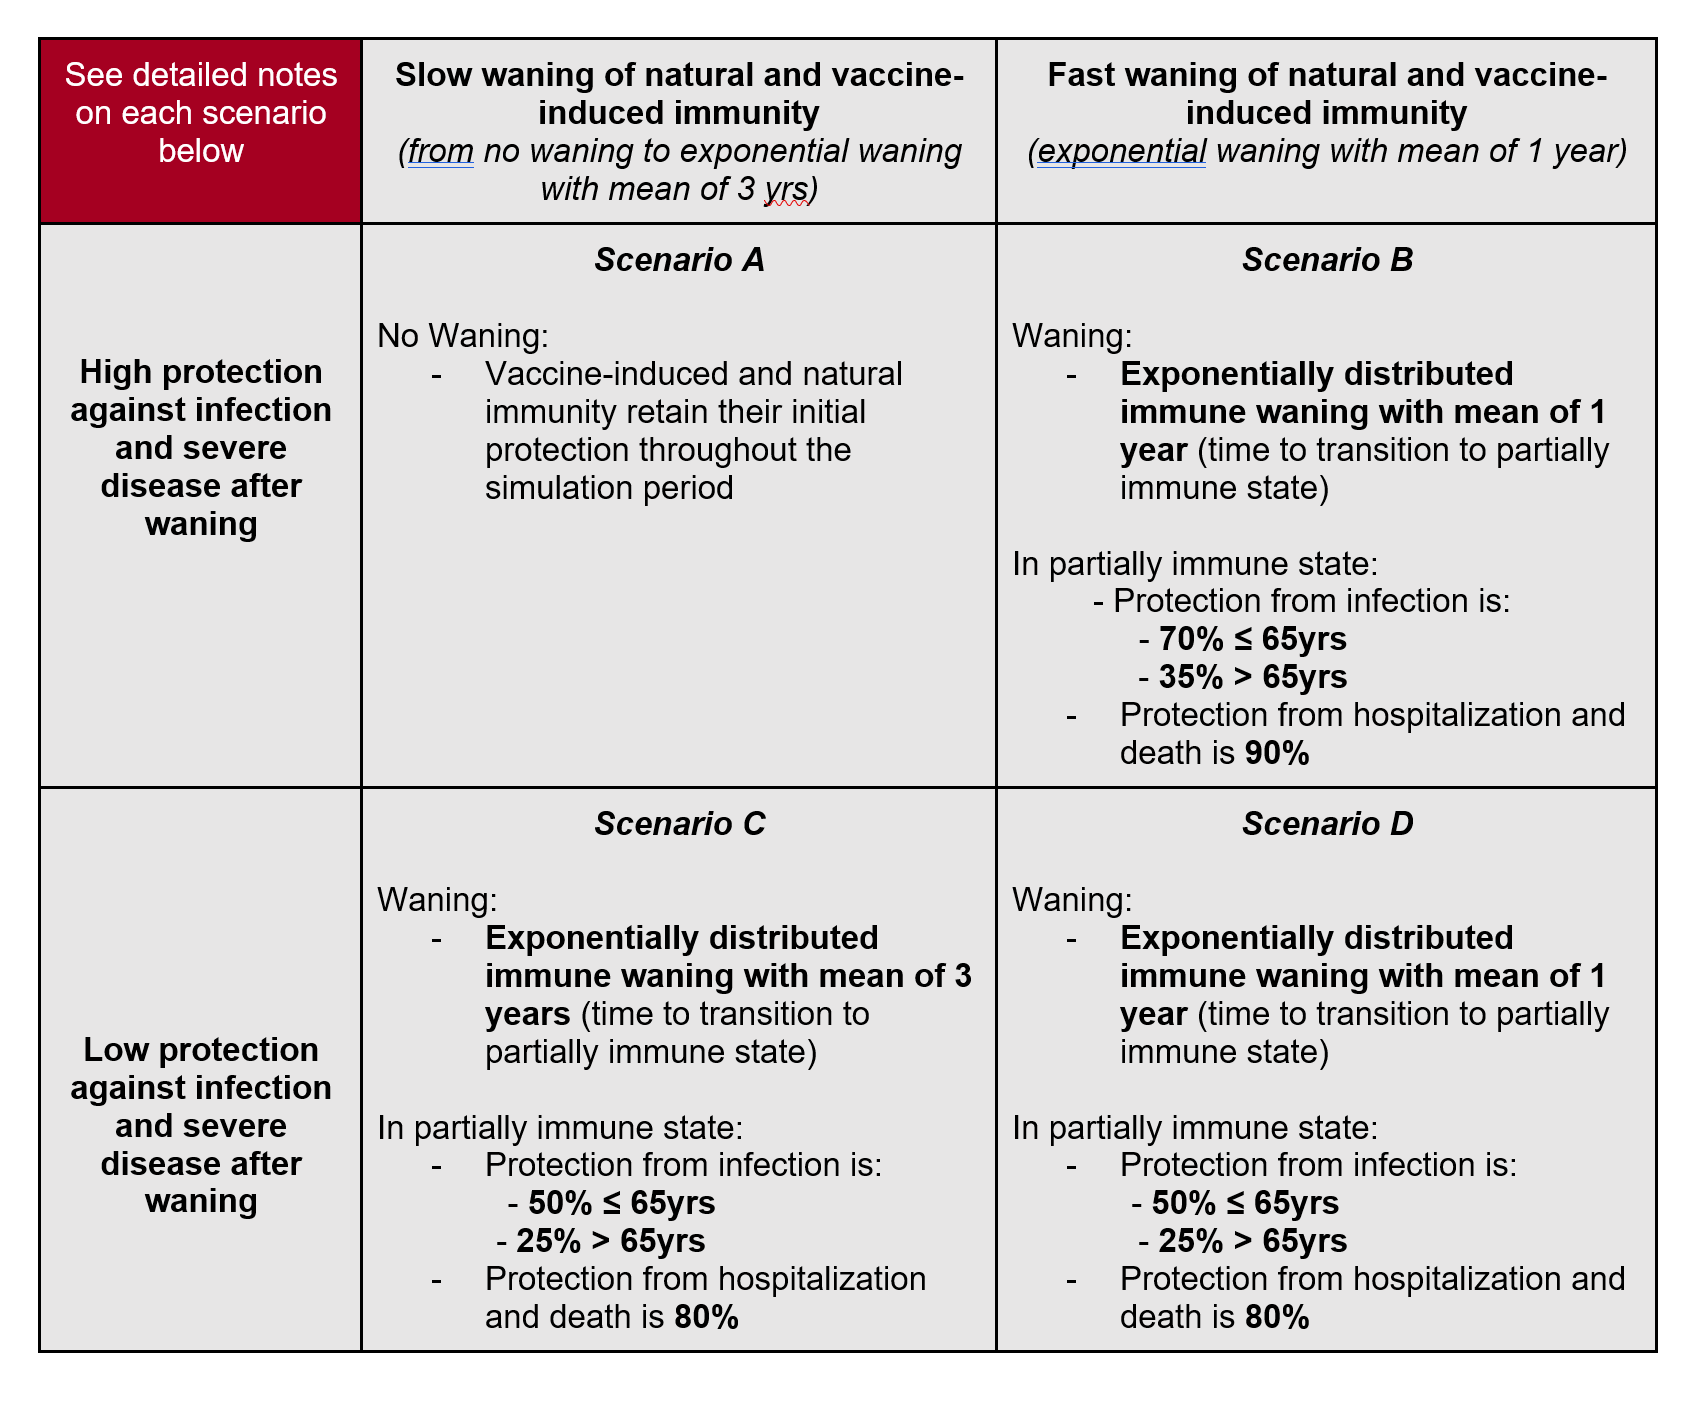
Model structure: Teams are encouraged to model waning immunity as a partial loss of immune protection, where individuals go back to a partially immune state after a period prescribed in the scenarios (mean of 1 or 3 yrs depending on the scenario). Individuals who have reached a partially immune state have reduced probabilities of reinfection and severe disease compared to naive individuals. In scenarios B-D, the distribution of immune decay should follow an exponential distribution. Scenario A has no waning. The same parameters should be used for waning immunity from natural infection and vaccination. Teams are encouraged to model these compartments separately however, in preparation for future scenarios focused on vaccine boosters.
Model parameters defined in scenarios: Parameters in these scenarios are based on observational studies of reinfection (natural immunity), vaccine breakthroughs, and models of decay of antibodies and VE over time. To illustrate the meaning of the scenario parameters, in scenario B for example, we have a protection from infection of 70% for individuals <65yrs in the partially immune state. This means that, for older individuals, the transition out of the partially immune state and into infection is 0.3*force of infection applied to naive individuals of the same age. If we apply this waning parameter to vaccinated people, this corresponds to a VE of 70% against infection. Further, in this scenario, protection against hospitalization and death is 90%. This estimate is similar to VE against hospitalization and death, so it is not a conditional probability. This means that if we follow two individuals over time, one with partial immunity and one completely naive, the probability that the partially immune individual will be hospitalized (die) from COVID19 is 0.1 times the probability that a naive individual will be hospitalized (die). Hence this probability combines protection against infection and protection against hospitalization/death given infection. If we apply this parameter to vaccinated individuals for whom immunity has partially waned, their VE against hospitalization and death becomes 90%.
Unconstrained model parameters: Teams should use their own judgments to parametrize protection against symptoms in the partially immune state, and any reduction in transmission that partially immune individuals may have. Teams can choose to treat individuals who have been infected and vaccinated differently from individuals who had a single exposure to the pathogen/antigen. We do not specify any waning for J&J (for which the starting point VE is much lower): teams can choose to ignore J&J, which represents a small fraction of all vaccinated in the US, or apply a different waning for J&J. We do not specify any waning for those who only get a 1st dose of Pfizer or Moderna and hence never acquire full vaccine immunity. We believe this represents a small fraction of all vaccinated. Teams can choose to apply a different waning to these individuals, or ignore them. All of these assumptions should be documented in meta-data.
Vaccination
- Doses available:
- 50M Moderna/Pfizer 1st doses available monthly, June 2021-January 2022
- J&J no longer available (after May 2021)
- Supply has likely eclipsed demand at this stage. Number of doses are for reference and as a reminder to account for different VE by manufacturer, but no longer indicate number of doses administered. Distribution of doses by manufacturer and associated vaccine efficacy should fit within these dose bounds.
- Coverage:
- Vaccine hesitancy is expected to cause vaccination coverage to slow and eventually saturate at some level below 100%. The coverage saturation, the speed of that saturation, and heterogeneity between states (or other geospatial scales) and/or age groups are at the discretion of the modeling teams. We suggest that the teams use estimates from the Delphi group, adjusted for potential bias in respondents and the Pulse Survey overall estimates, adjusted for survey participant vaccination coverage.
- VE:
- We recommend that teams use a VE of 35% for 1st dose and 85% for second dose against symptoms for Moderna and Pfizer versus the Delta variant. These estimates reflect VE before any waning takes place.
- VE is defined here as vaccine effectiveness against symptomatic disease. Teams should make their own informed assumptions about effectiveness and impacts on other outcomes (e.g., infection, hospitalization, death).
Variant progression and transmissibility: Teams should use their own judgment to project the continued progress and transmissibility of the Delta variant across US states. In this scenario, no new variant would arrive in the US between now and the end of the projections. Initial prevalence should be estimated or defined by the teams based on sequencing and other relevant data, preferably at the state level. The variant is more transmissible but it is not an immune escape variant. Teams can set an increased severity of the Delta variant, but this should be documented in meta-data.
NPI: In contrast to past scenarios, we don’t specify different levels of non-pharmaceutical interventions (NPI) use; however, teams should consider that most schools intend to return to in-person education in the fall. Teams should also note the change in CDC mask recommendations for vaccinated people in high-transmission areas on 07/27/2021.The future level of NPIs are left at the discretion of the modeling teams and should be specified in the teams’ metadata.
| Scenario | Scenario name for submission file | Scenario ID for submission file |
|---|---|---|
| Scenario A. No Waning | noWan | A-2021-08-17 |
| Scenario B. High Protection, Fast Waning | highPro_fastWan | B-2021-08-17 |
| Scenario C. Low Protection, Slow Waning | lowPro_slowWan | C-2021-08-17 |
| Scenario D. Low Protection, Fast Waning | lowPro_fastWan | D-2021-08-17 |
- Due date: August 17, 2021
- End date for fitting data: August 7-14, 2021 (cut-off date at the discretion of individual teams; we’d prefer data through August 7 at least be used; no fitting should be done to data after August 14)
- Start date for scenarios: August 15, 2021 (first date of simulated transmission/outcomes)
- Simulation end date: February 12, 2022 (26-week horizon)
- Social Distancing Measures:
- Includes combined effectiveness/impact of all non-pharmaceutical interventions and behavior change.
- Current and future levels of social distancing are to be defined by the teams based on their understanding of current and planned control and behavior and expectations. Teams should consider that most jurisdictions are opening fairly quickly, and most schools intend to return to in-person education in the fall. No reactive interventions should be planned.
- Testing-Trace-Isolate: constant at baseline levels
- Masking: Included as part of “Social Distancing Measures” above.
- Immune waning and Immune escape: As defined by the scenarios.
- Vaccination:
- Pfizer / Moderna
- Vaccine efficacy (2-dose vaccines):
- B.1.1.7
- First dose: 50% against symptoms, 14 days after 1st dose
- Second dose: 90% against symptoms, 14 days after 2nd dose
- B.1.617.2
- First dose: 35% against symptoms, 14 days after 1st dose
- Second dose: 85% against symptoms, 14 days after 2nd dose
- Effectiveness and impact on infection and other outcomes (hospitalizations, deaths) is at team’s discretion and should be clearly documented in team’s metadata.
- Doses 3.5 weeks apart
- B.1.1.7
- Vaccine availability:
- December-August 13: based on data on administered doses
- August 14-February 2022: 50 million available first doses/month, with the intention of protocols being followed (100M doses/mo)
- Vaccine efficacy (2-dose vaccines):
- Johnson & Johnson
- Vaccine efficacy (1-dose):
- 70% VE against previous strains; 60% VE against B.1.1.7/B.1.617.2
- Vaccine availability:
- March-May: based on data on administered doses, with continuing at rate current on date of projection for remainder of month (~10M total administered).
- June-January: No longer available; only 10M of 20M doses administered, supply, safety, and demand issues.
- Manner for accounting for protection provided in the 10M vaccinated during March-May at team's discretion.
- Vaccine efficacy (1-dose):
- Pfizer / Moderna
- Vaccine Hesitancy: At teams' discretion.
- Delta (B.1.617.2) variant strain: At teams’ discretion. No immune escape feature for Delta variant. Transmission assumptions: models fit to US state-specific dynamic up until "End date for fitting data" specified above – no prescribed R0, interventions, etc.
- Transmission assumptions: models fit to US state-specific dynamic up until "End date for fitting data" specified above – no proscribed R0, interventions, etc.
- Pathogenicity assumptions: no exogenous fluctuations in pathogenicity/transmissibility beyond seasonality effects
- Vaccine effectiveness: see recommendations (same VE in all scenarios); assumptions regarding time required to develop immunity, age-related variation in effectiveness, duration of immunity, and additional effects of the vaccine on transmission are left to the discretion of each team
- Vaccine allocation: between-state allocation is based on population per the CDC/NAS guidelines (proportional allocation); within-state allocation and the impact of vaccine hesitancy are left to the discretion of each team
- Vaccine immunity delay: There is approximately a 14 day delay according to the Pfizer data; because we suspect the post first dose and post second dose delays may be of similar length, we do not believe there is any need to explicitly model a delay, instead groups can delay vaccine receipt by 14 days to account for it
- Vaccine uptake: See specific details.
- Vaccine roll-out: roll-out to follow ACIP recommendations unless known to be contradicted by state recommendations
- Phase 1a: health care workers, long-term care facilities
- Phase 1b: frontline essential workers, adults 75+
- Phase 1c: other essential workers, adults with high-risk conditions, adults 65-74
- NPI assumptions: NPI estimates should be based on current trends and reported planned changes.
- Database tracking of NPIs: teams may use their own data if desired, otherwise we recommend the following sources as a common starting point:
- Geographic scope: state-level and national projections
- Results: some subset of the following
- Weekly incident deaths
- Weekly cumulative deaths since start of pandemic (use JHU CSSE for baseline)
- Weekly incident reported cases
- Weekly cumulative reported cases since start of pandemic (use JHU CSSE for baseline)
- Weekly incident hospitalizations
- Weekly cumulative hospitalizations since simulation start
- Weeks will follow epi-weeks (Sun-Sat) dated by the last day of the week
- “Ground Truth”: The same data sources as the forecast hub will be used to represent “true” cases, deaths and hospitalizations. Specifically, JHU CSSE data for cases and deaths and HHS data for hospitalization.
- Metadata: We will require a brief meta-data form, TBD, from all teams.
- Uncertainty: aligned with the Forecasting Hub we ask for 0.01, 0.025, 0.05, every 5% to 0.95, 0.975, and 0.99 quantiles
- Ensemble Inclusion: at present time, in order to be included in the ensemble models need to provide a full set of quantiles