👋 Speedracer was a great experiment but it's not maintained anymore. Let me know if you know a good alternative that I can redirect to.
🏎️💥 ............ 🚗🚕🚙🚓🚒🚐🚚🚌🚛🚜
Collect performance metrics for your library/application.
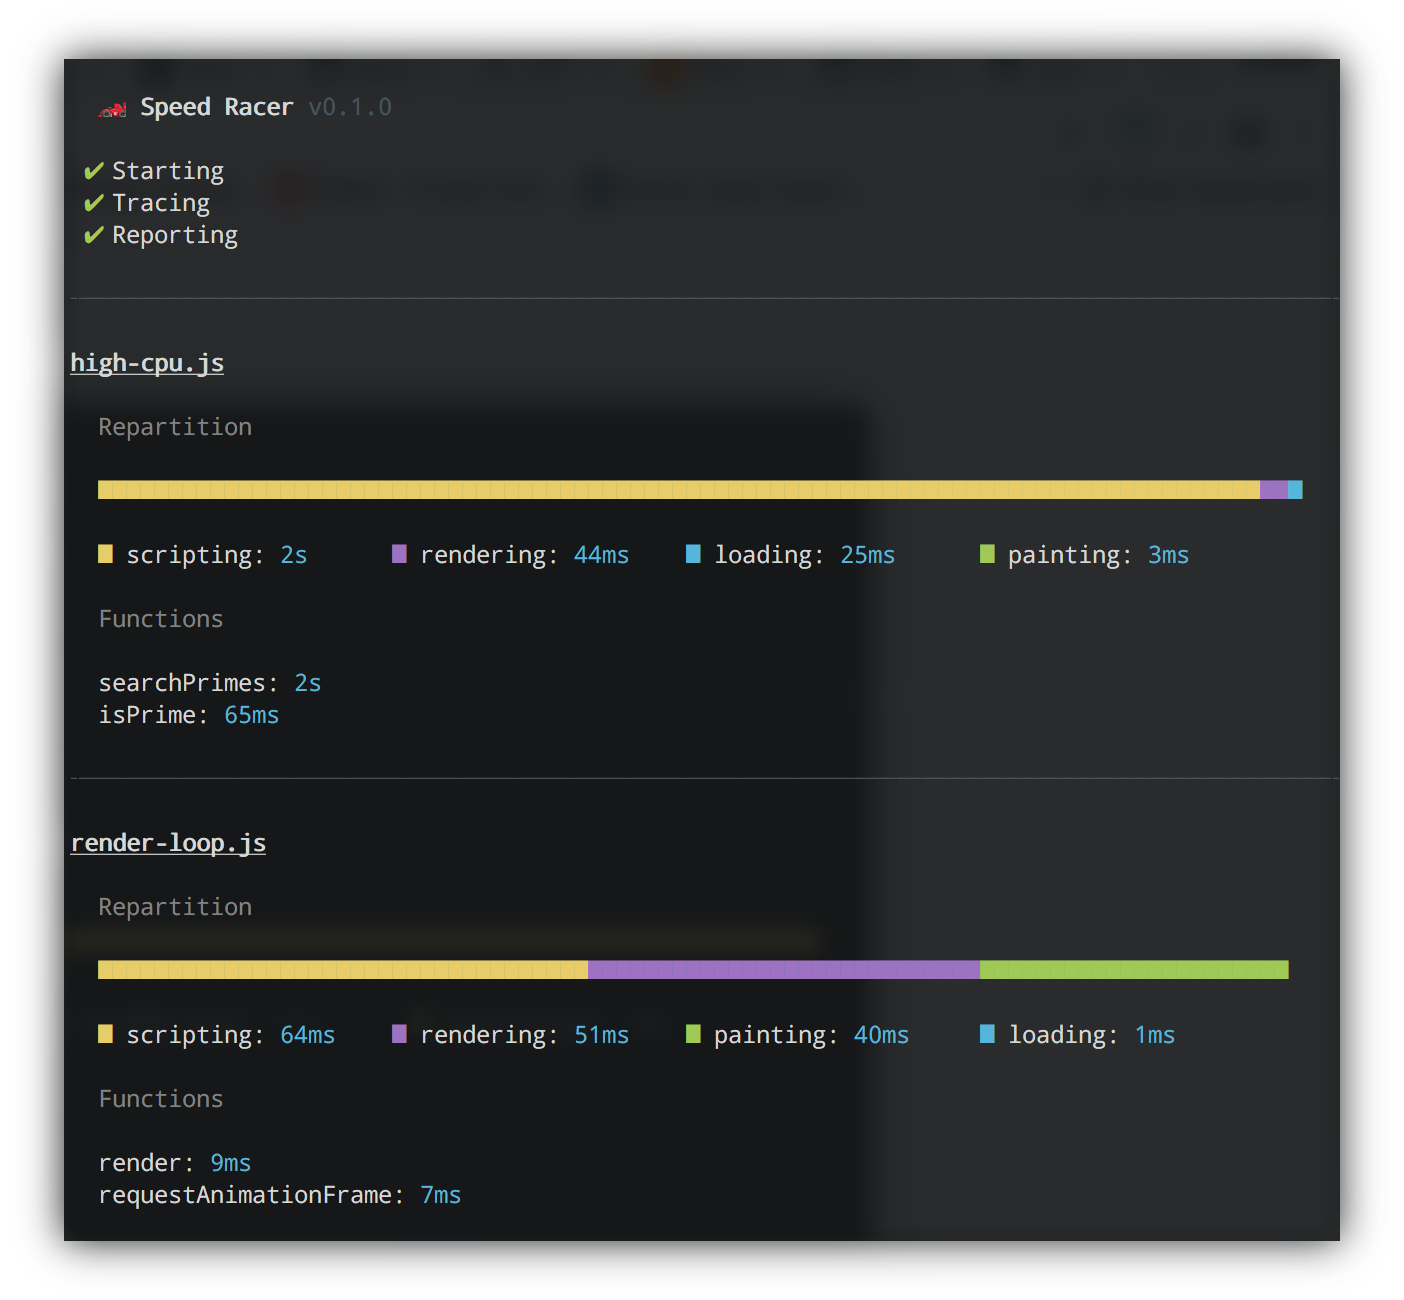
Speed Racer is a performance runner, like a test runner, but for performance 🏎️. It runs scripts (races) in Chrome (headlessly if possible) and produces detailed traces and reports on scripting, rendering and painting.
See what's new in 📦
0.2.0
or what's being cooked for 📦
0.3.0
npm install -g speedracerSpeed Racer needs Google Chrome to run your files. It will run it headlessly if it finds a proper intallation of Canary (Mac OS X only for now).
Speed Racer comes with two commands right now:
run: collect performance metrics and save them.display: display a summary of generated reports.
A race can be seen as a unit test. It contains a piece of code that will be profiled by Speed Racer. Under the hood, it uses Chrome DevTools protocol to drive Chrome and collect traces.
Races can import es6 / commonjs modules and use most of es6 features, depending on your version of Google Chrome: es6 support
Here is an example of a file containing a race:
import race from 'speedracer'

race('my first race', () => {
  // ... stuff to profile
})
You can define as many races as you want per file, Speed Racer will collect and run them sequentially.
You can also define asynchronous races like so:
import race from 'speedracer'

race('my first async race', () =>
new Promise(resolve => {
  // ... stuff to profile
  resolve()
}))Then you need to collect metrics!
For each race, Speed Racer will produce two artifacts:
- a trace: a raw dump of Google Chrome tracing events, it contains a lot of detailed metrics about your race.
- a report: a report created by Speed Racer from those events, it summarizes important metrics.
Those artifacts will be saved in the .speedracer directory by default.
To run races, type speedracer run perf/*.js or simply speedracer perf/*.js. Note that it will run all .js files in the perf directory by default, so you can omit perf/*.js if you are using this directory.
For more details, type speedracer run --help.
You can browse examples here.
Once the artifacts have been created, you can quickly display a summary report for each run. Type speedracer display to see all the reports or speedracer display .speedracer/a-file-name/* to see the reports of a specific file.
For more details, type speedracer display --help.
Speed Racer is still a baby so it does not provide advanced analysis yet, just a basic summary. But it has several goals:
- regression testing: compare runs over time and report how it's faster/slower.
- benchmarking: compare several races to see which is the best.
- analysis: give precise insights of what is slow and why.
- auditing: give advices on how to improve performance.
If you want to use Speed Racer for one of this use cases, you can leverage it and analyze the traces and reports it produces. I would be glad to receive your feedback and ideas on the subject!
Traces are json files with the .trace.gz extension. They are basically huge arrays of events produced by Google Chrome. Those events give tons of informations about the overall performance of race. Here is the detail format.
Traces can be pretty big, so they are saved gziped.
You can analyze them the way you want or load them in the Timeline/Performance tab of Chrome like so:
- Locate and decompress your trace:
# first you need to locate and decompress the trace

$ cd .speedracer
$ ls
text-fixtures-multiple
$ cd text-fixtures-multiple
$ ls
render-60-frames.speedracer
render-60-frames.trace.gz
search-10e4-first-primes-very-long.speedracer
search-10e4-first-primes-very-long.trace.gz
$ gunzip render-60-frames.trace.gz- Load it in Chrome Devtools or use DevTools Timeline Viewer and enjoy 🎉
Reports are json files with the .speedracer extension. They provide a performance summary for a given race.
Here is the format:
{
  "meta": {
    "title": "render 60 frames",
    "group": "test-fixtures-multiple",
    "id": "render-60-frames"
  },
  "profiling": {
    "categories": {
      "scripting": 13.217000007629395,
      "rendering": 11.370999991893768,
      "painting": 9.248999938368797
    },
    "events": {
      "Animation Frame Fired": 7.994999974966049,
      "Composite Layers": 7.0119999796152115,
      "Update Layer Tree": 6.503000020980835,
      "JS Frame": 5.1060000360012054,
      "Recalculate Style": 4.867999970912933,
      "Paint": 2.236999958753586,
      "Run Microtasks": 0.11599999666213989
    },
    "functions": {
      "FireAnimationFrame": 7.994999974966049,
      "CompositeLayers": 7.0119999796152115,
      "UpdateLayerTree": 6.503000020980835,
      "UpdateLayoutTree": 4.867999970912933,
      "f:render@24": 2.32600000500679,
      "Paint": 2.236999958753586,
      "f:requestAnimationFrame@": 2.1010000109672546,
      "f:ws.onmessage@24": 0.1940000057220459,
      "f:finishRace@24": 0.15600000321865082,
      "f:@": 0.1300000101327896,
      "RunMicrotasks": 0.11599999666213989,
      "f:Promise@": 0.10099999606609344,
      "f:startRace@24": 0.09800000488758087
    }
  },
  "rendering": {
    "firstPaint": 0.00805,
    "fps": {
      "mean": 60.98,
      "variance": 3.9,
      "sd": 1.97,
      "lo": 56.92,
      "hi": 63.47
    }
  }
}
You can display, analyze or compare them depending on your needs.
🏎️💥 ............ 🚗🚕🚙🚓🚒🚐🚚🚌🚛🚜


