Add TriMesh element #2143
Add TriMesh element #2143
Conversation
|
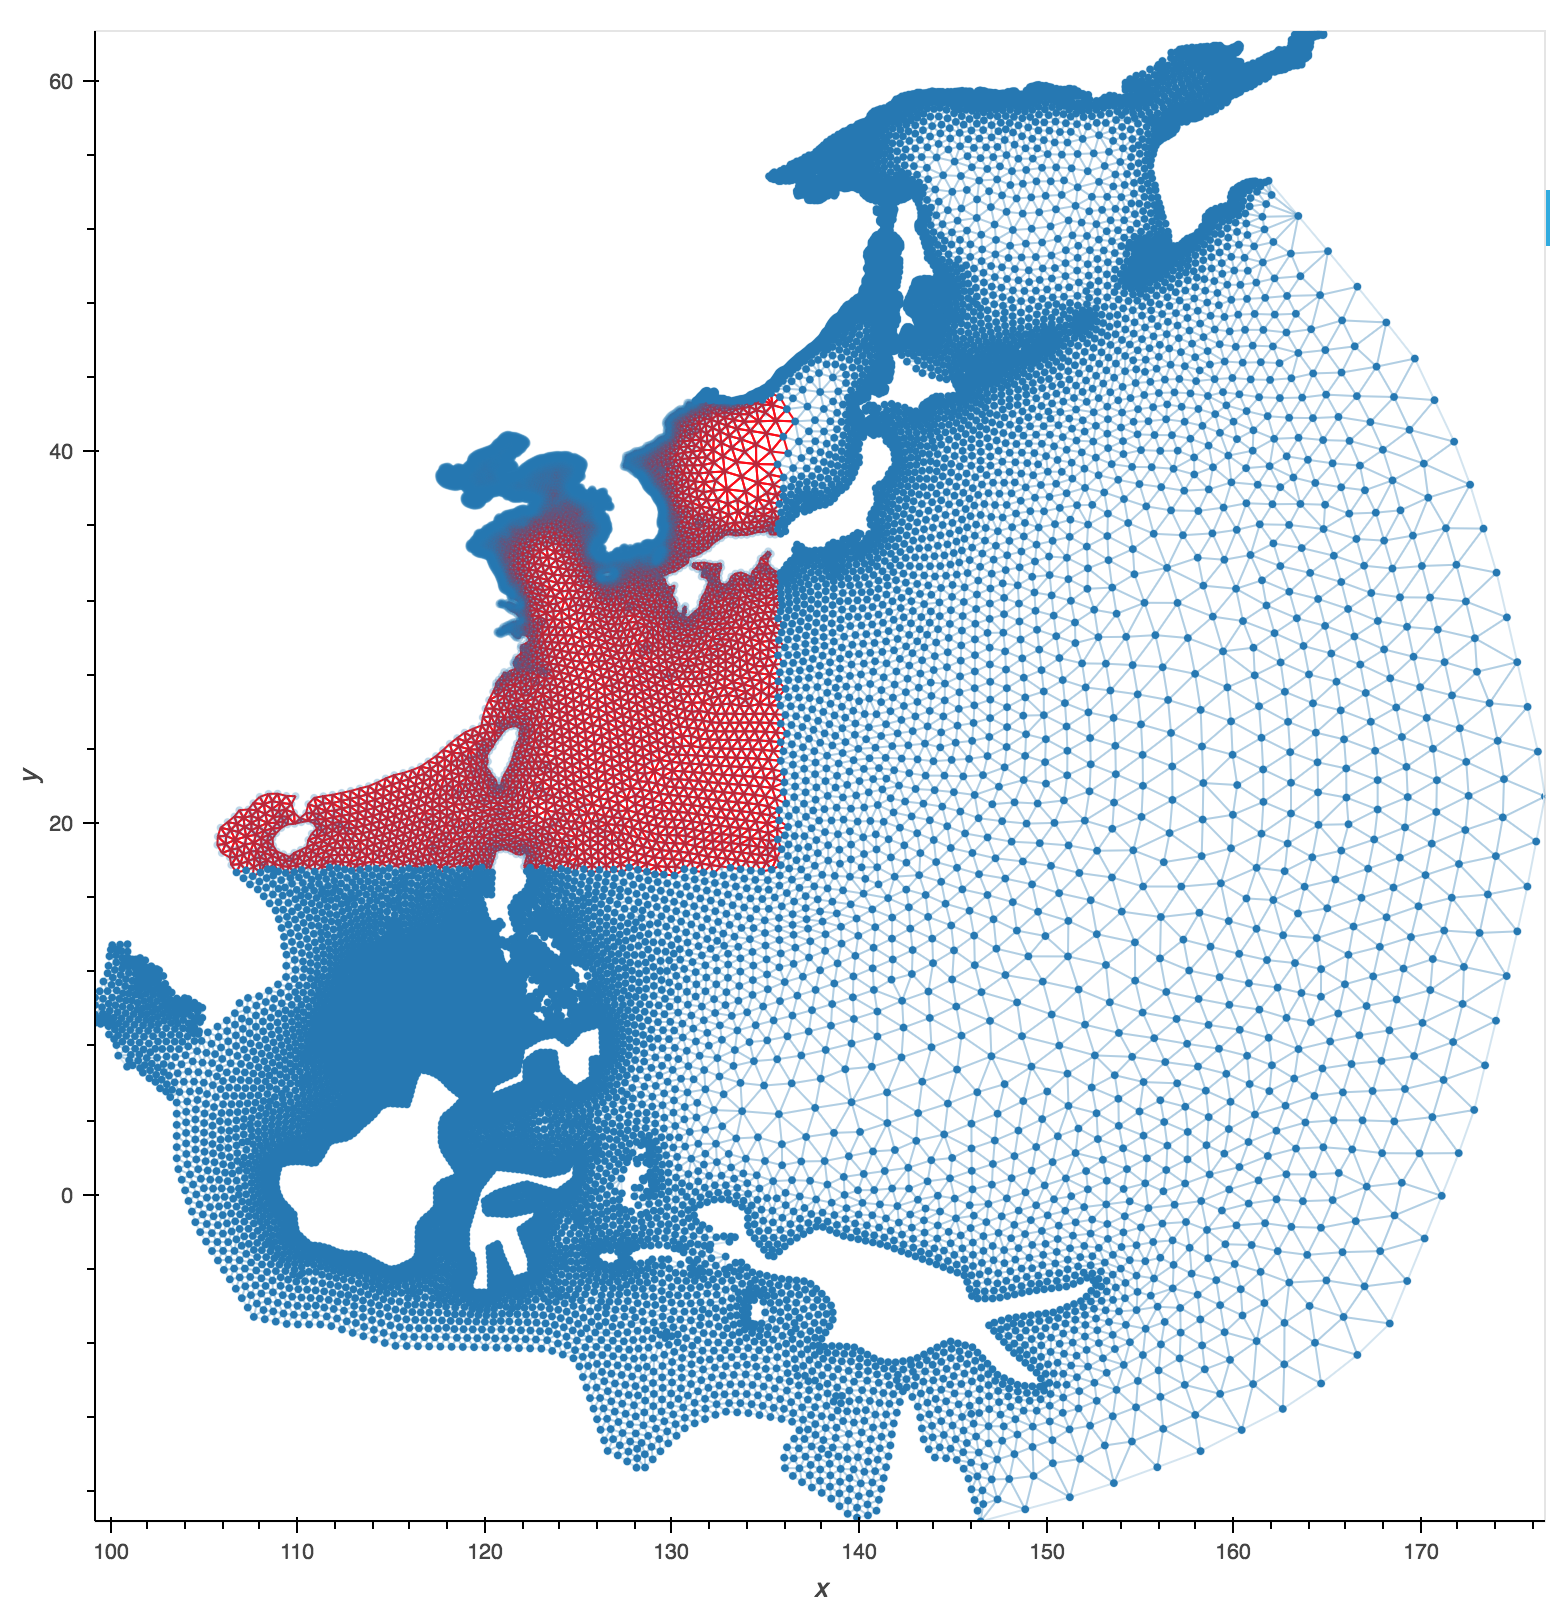
If you enable WebGL rendering in bokeh you can actually scale up to some pretty large meshes, here is an example of selecting on 40485 triangles:
|
2580acb
to
b6a8f6c
Compare
|
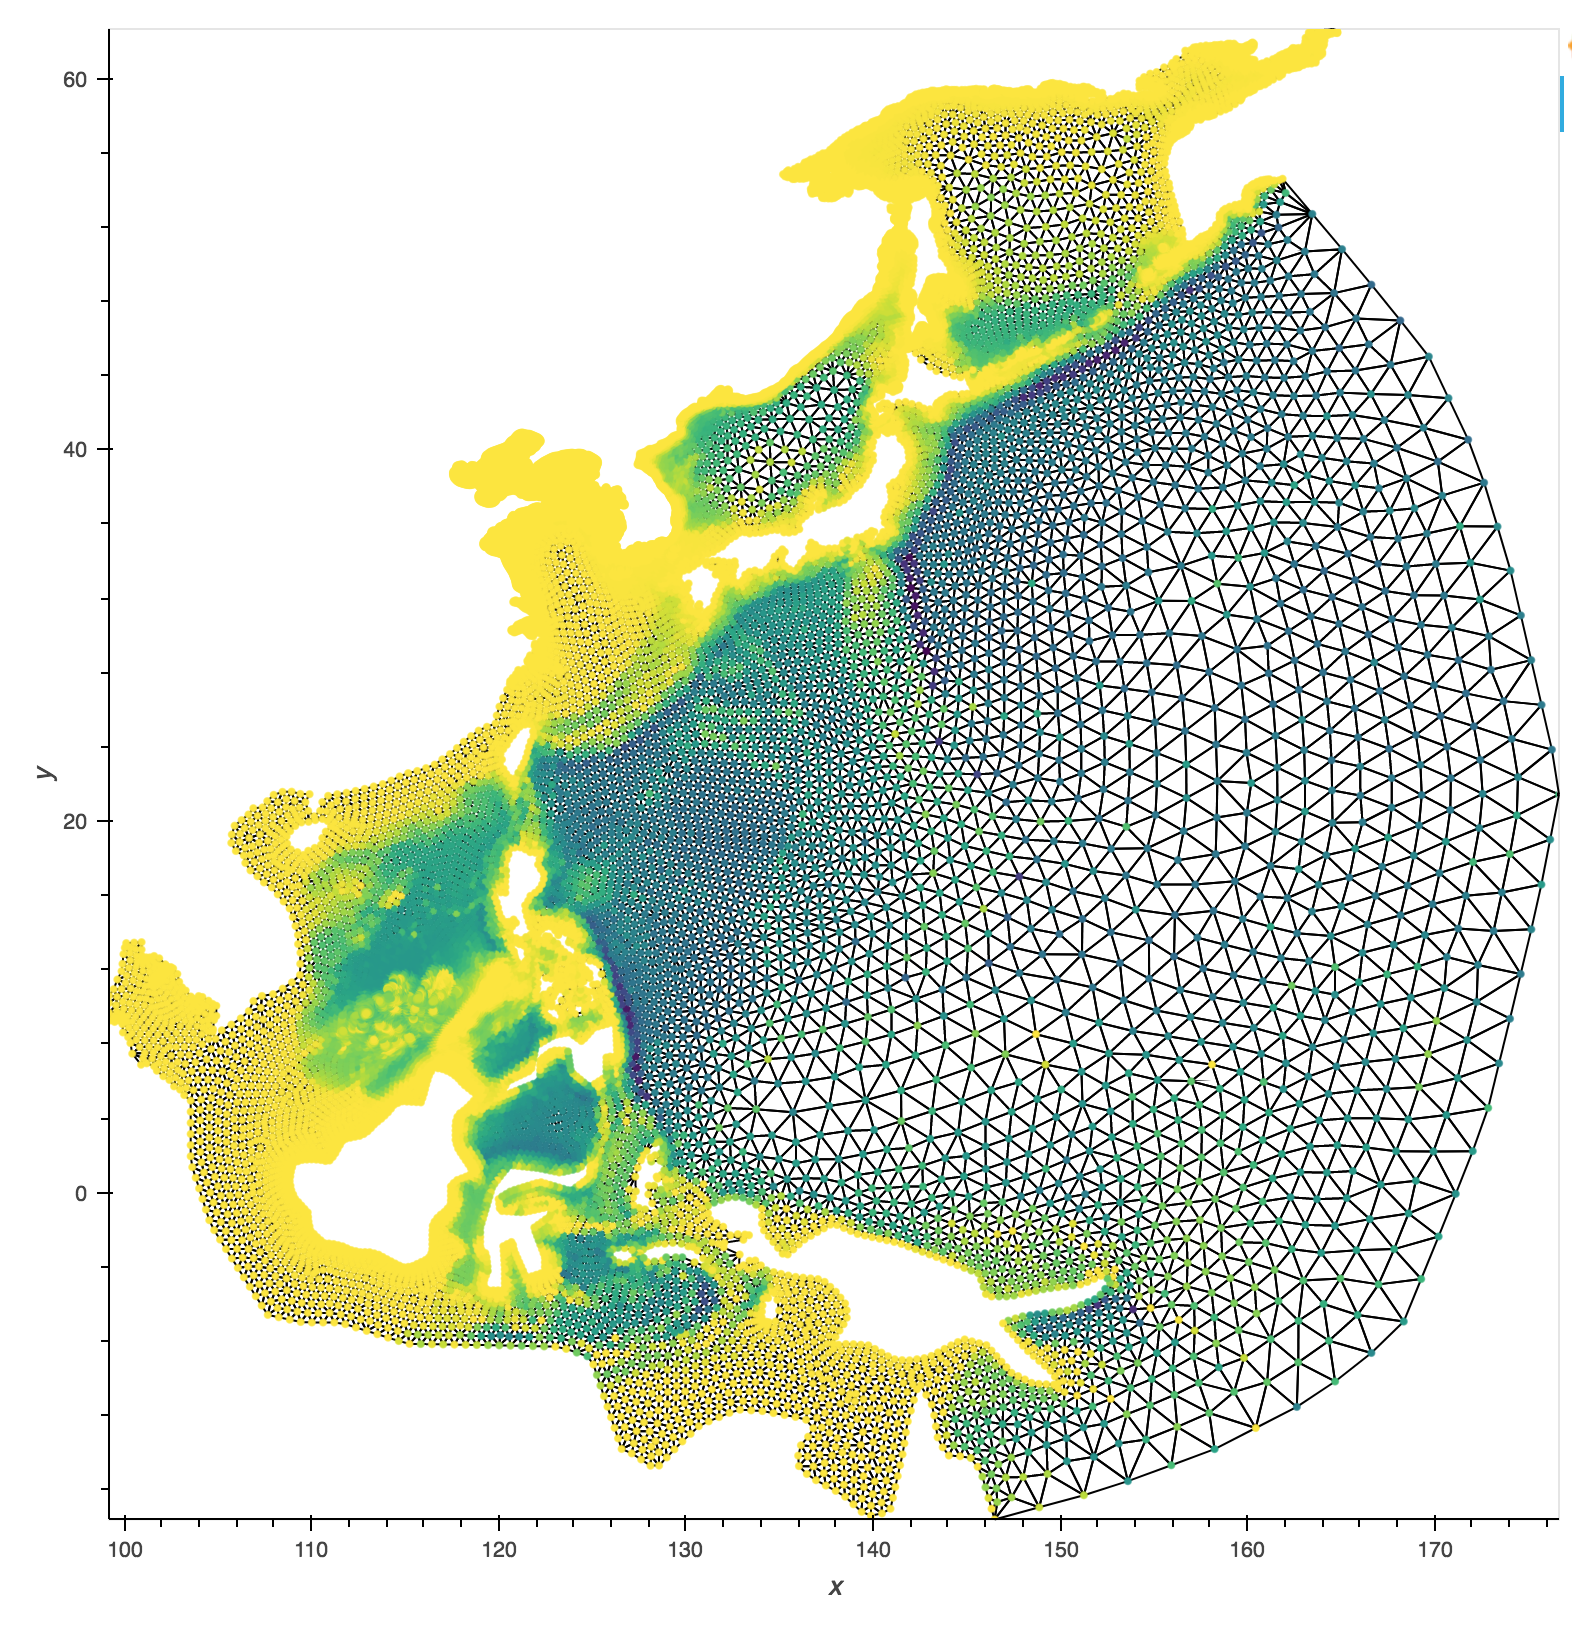
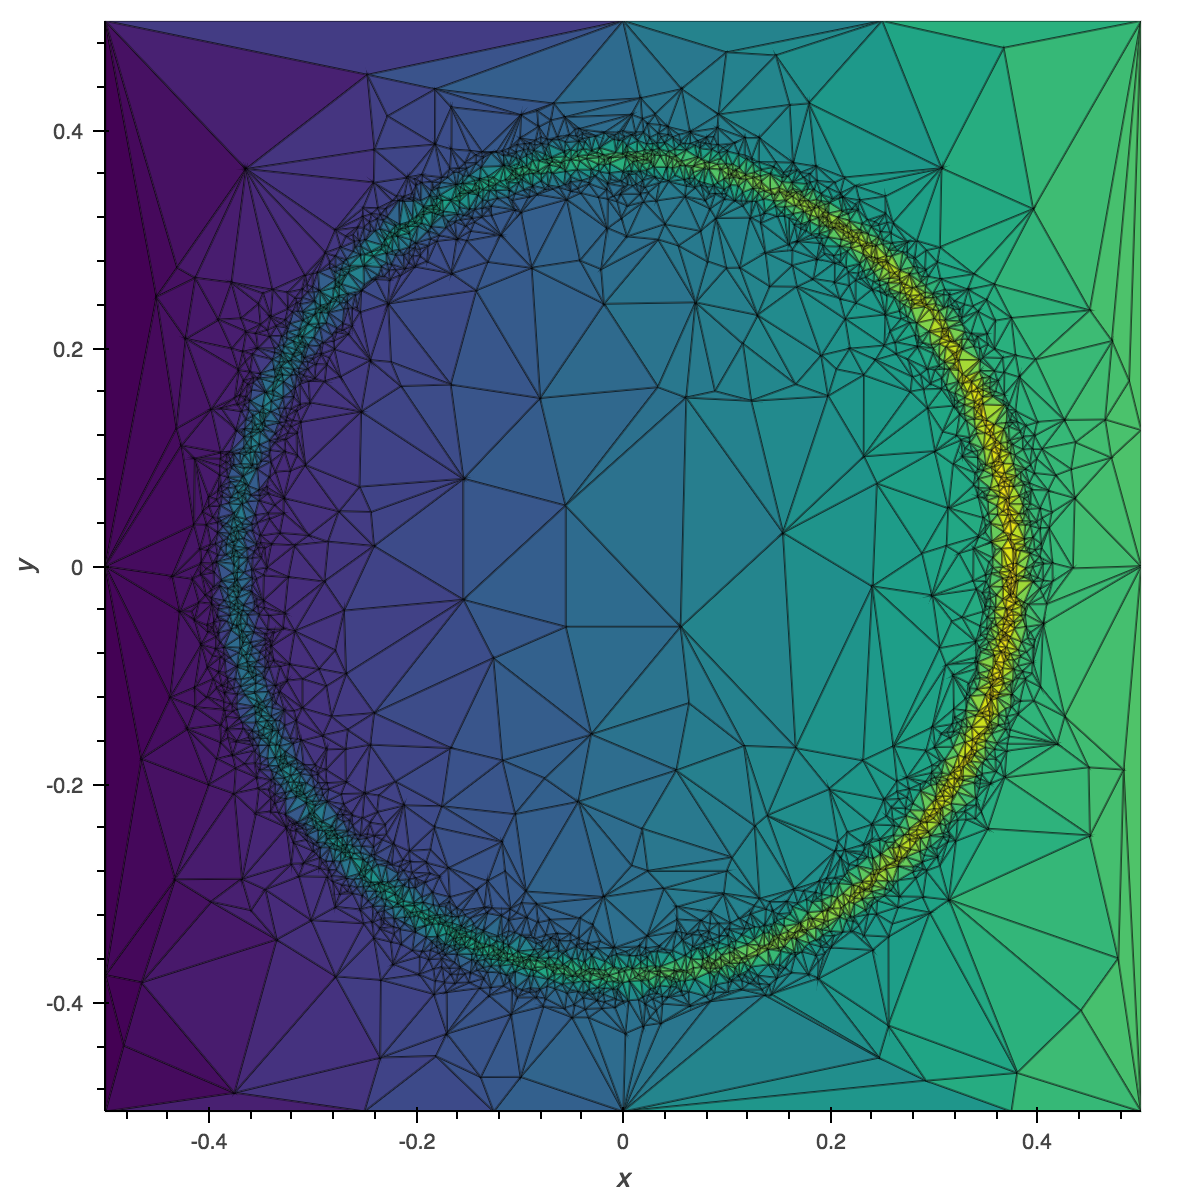
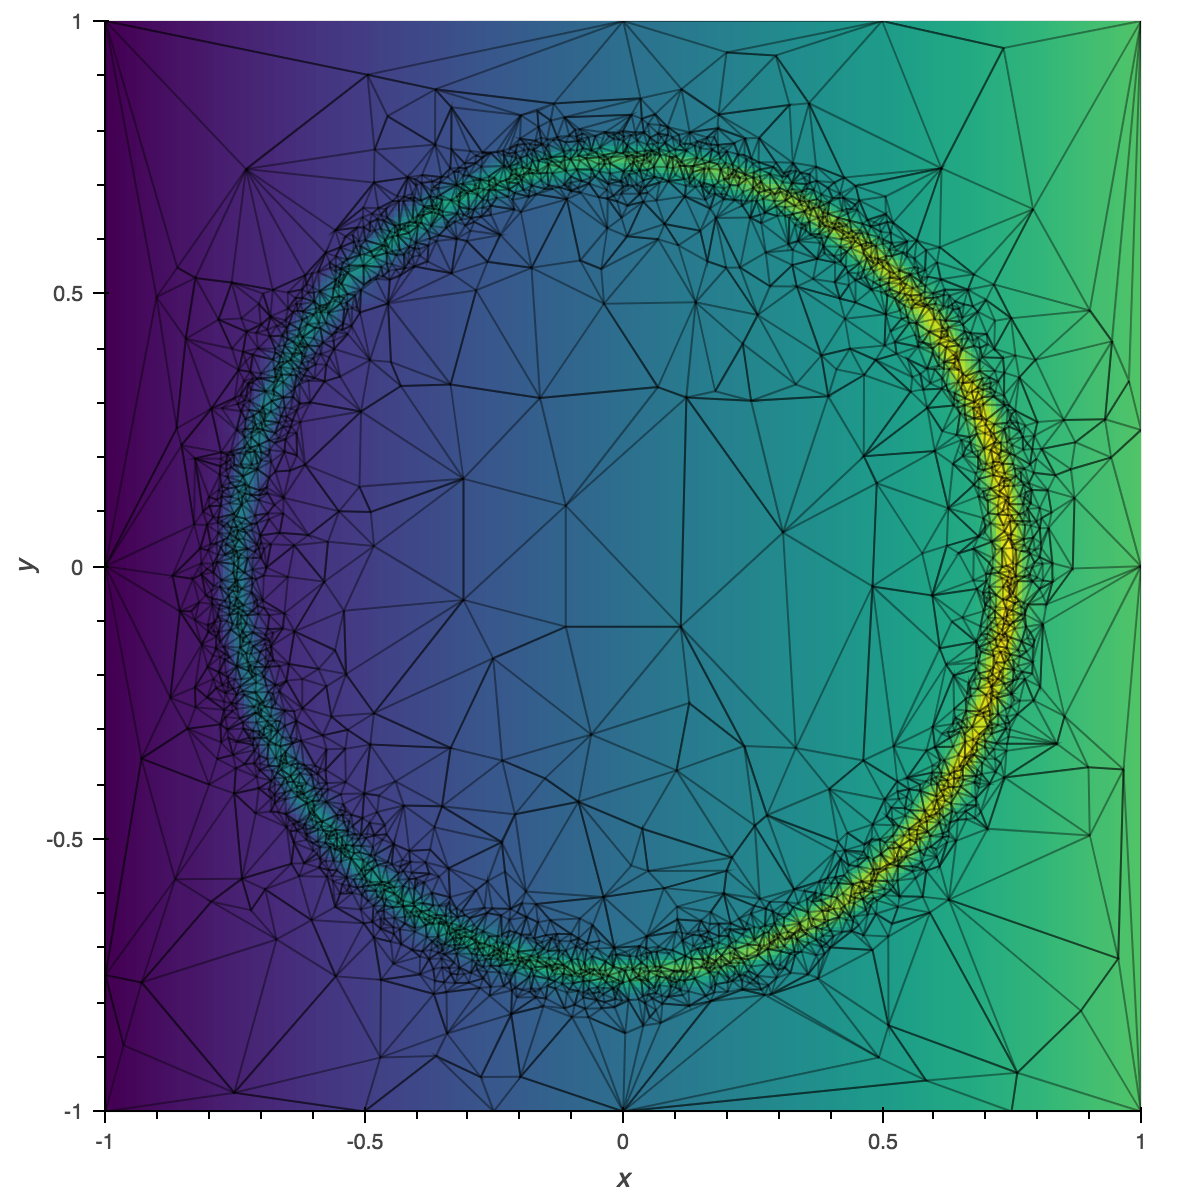
I've now allowed filling the triangles by a value, so here's the example above this time with filled triangles:
I'd now consider this PR ready for review, I've added unit tests and reference notebooks. The datashading portion will follow in another PR once it's been merged into datashader. |
|
Yay, we even gained coverage. |
|
I am trying this out since I work a lot with triangulations, currently, I create plots like: Using this branch I am trying to get something similar, but it's not getting better: %%output size=200
%%opts TriMesh (node_size=0 edge_line_width=0.1 edge_nonselection_alpha=0.01)
plot * hv.TriMesh((tris.simplices, points))
I am unable to set the |
|
Another question, the |
|
Looks like you're using the matplotlib backend but specifying bokeh options, try changing that to
Have a look at the example notebook, the last example demonstrates it. Going to be pushing a small fix for that shortly. |
7a2e21f
to
ea5a1d2
Compare
|
@jlstevens @jbednar Requesting review. |
holoviews/operation/datashader.py
Outdated
| Element or overlay of Elements into an hv.Image or an overlay of | ||
| hv.Images by rasterizing it, which provides a fixed-sized | ||
| Element or overlay of Elements into an hImage or an overlay of | ||
| .Images by rasterizing it, which provides a fixed-sized |
holoviews/operation/datashader.py
Outdated
| return Image(agg, **params) | ||
|
|
||
|
|
||
| class rasterize(trimesh_rasterize): |
There was a problem hiding this comment.
How can rasterize be derived from trimesh_rasterize? That seems like a broken type hierarchy, as it does not satisfy "is a" ("rasterize" is not a kind of "trimesh_rasterize").
There was a problem hiding this comment.
True, it was easiest to inherit all the methods and parameters but a cleaner class hierarchy is worth the extra handling.
| (not isinstance(x, Image) or x in imgs)) | ||
| element = element.map(dsrasterize, predicate) | ||
| return element | ||
|
|
There was a problem hiding this comment.
Does this not yet handle regridding?
There was a problem hiding this comment.
I was going to handle that in another PR once datashader has made the API more consistent.
There was a problem hiding this comment.
Ok. And that's on my plate, but after this conference prep...
|
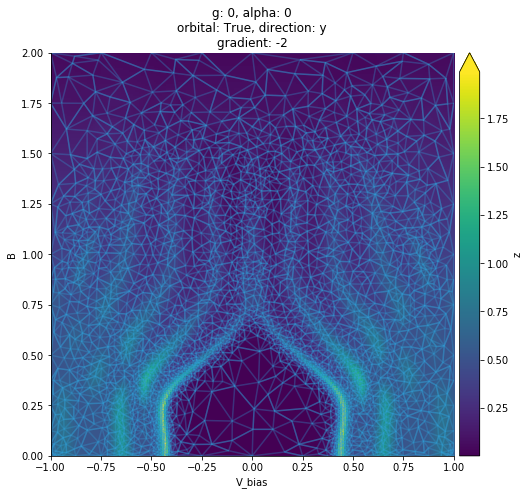
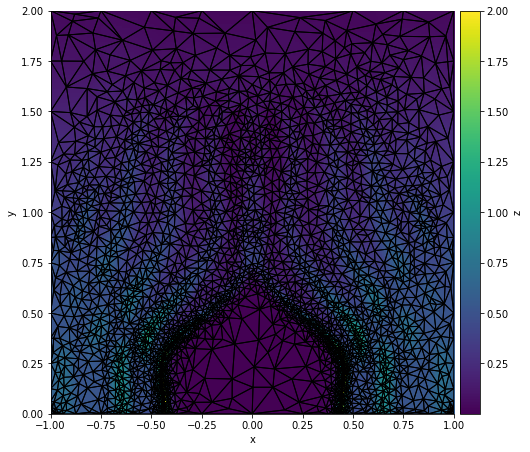
Great work! 👍 How can I use the interpolation here? How do I go from: %%opts TriMesh [filled=True edge_color_index='z'] (cmap='viridis' node_alpha=0 edge_line_alpha=0.4)
def plot_TriMesh(learner):
ip = learner.ip()
simplices = ip.tri.simplices
nodes = ip.tri.points
z = ip.values[simplices].mean(axis=1)
return hv.TriMesh((np.column_stack([simplices, z]), nodes), vdims='z')
plot_TriMesh(learner)
to
I would like to know because: %timeit plot_TriMesh(learner)
2.71 ms ± 309 µs per loop (mean ± std. dev. of 7 runs, 100 loops each)
%timeit learner.plot(triangles_alpha=0.4)
216 ms ± 13.9 ms per loop (mean ± std. dev. of 7 runs, 1 loop each)EDIT however |
|
For the same reason Would it be easy to make this work with My data is calculated and plotted live, and in be beginning there might not be data to plot yet. Then I could write beautiful things like: if self.data:
x = y = np.linspace(-0.5, 0.5, n)
ip = self.ip()
z = ip(x[:, None], y[None, :])
image = hv.Image(z, bounds=lbrt)
tris = hv.TriMesh((ip.tri.simplices, self.unscale(ip.tri.points)))
tris = tris.opts(style=dict(edge_line_alpha=triangles_alpha))
plot = image * (tris if triangles_alpha else hv.TriMesh(([], [])))
else:
plot = hv.Image([]) * hv.TriMesh(([], [])) |
c8d9a02
to
ea3c38f
Compare
|
@basnijholt Both |
|
How can I change the colors of the edges? (I think) I've tried all style parameters with |
|
@basnijholt Are your values on the vertices or simplexes? Currently it only allows coloring by values on the simplexes. |
|
@jlstevens Requesting review again. |
The values are at the vertices. |
holoviews/operation/datashader.py
Outdated
| """ | ||
| Rasterize is a high-level operation which will rasterize any | ||
| Element or combination of Elements supplied as an (Nd)Overlay by | ||
| aggregating with the supplied aggregation it with the declared |
There was a problem hiding this comment.
Need to fix this docstring.
holoviews/element/graphs.py
Outdated
| supplied, which will ensure the selection is only applied if the | ||
| specs match the selected object. | ||
| """ | ||
| self.edgepaths |
There was a problem hiding this comment.
Will add a comment about this. By default edgepaths are not computed but .select expects it to be.
There was a problem hiding this comment.
Yes, a comment next to this line explaining it would be a good idea.
|
Addressed the comments, added vertex averaging and updated the reference notebooks. Ready for a final review. |
|
New changes look good and tests have passed. Merging! |
Triangle meshes are a common form of data when working with complex polygons and are frequently employed in environmental modeling. The most common way to compute such a mesh is using Delaunay triangulation and the data is usually represented as two data structures:
This representation is in fact simply a specific type of graph and closely follow the data structures we already use for graphs, where the simplices represent the abstract connectivity of the mesh and the nodes represent the positions. It was therefore trivial to write a
TriMeshelement which simply reuses the same data structures, organization, and plotting code as existing graph elements.Here is a simple example:
This approach is reasonably fast for small meshes (~1 second/5000 triangles) and once you start plotting more than ~10k triangles you will want to use datashader anyway. It is also flexible enough to associate additional values both with the simplices and with the nodes.
Once holoviz/datashader#525 is merged I will get on with allowing datashader operation such as aggregate to operate on the TriMesh element.