⚠️ tgraphis currently in active development, so interfaces and documentation are in a very early stage
Plain-simple Rust crate providing for drawing graphs in the terminal based on a function. It provides an interface for drawing the graph of a function by passing a Rust closure/function, also enabling you to draw multiple functions inside the same graph.
- Drawing graph with single function
- Drawing graph with multiple functions
- Customize function display (only color and character as of now, more to come)
- Option to limit graph height
- Interactive graphs: move and zoom
- Draw negative values
- Record terminal showing off tgraph
- More ideas to come! Drop yours in the issues tab!
To draw a function, a wrapper that represents a graph is used. There are two types of graphs: a single function graph (Graph) and a multiple function graph (MultiGraph). Although you could just use MultiGraph, for single functions Graph is recommended, as MultiGraph adds some code not needed just for one function.
Both structs provide the same interface. To create a graph (used Graph for simplicity, for MultiGraph see the docs), you use Graph::new(f, width: u32, height: Option<u32>) where f is the function/closure (further explained below) and height is automatically set if None is passed, or you can also use Graph::new_screen(f, height: Option<u32>) which picks up the width of the screen. If you want to customize the graph with options, you can call Graph::with_options and Graph::with_options_screen respectively and pass a GraphOptions struct as last parameter (see more in the Graph Customization section).
Functions that can be drawn are restricted to types that implement the tgraph::AsF64 trait, which allows the parameters of the function to be created from a f64 and the result of the function to be converted to a f64, as drawing in the screen is made pixel by pixel. You can implement this trait to whichever type you want, meaning that a struct representing people can be drawn as part of a graph is you implement tgraph::AsF64 on it.
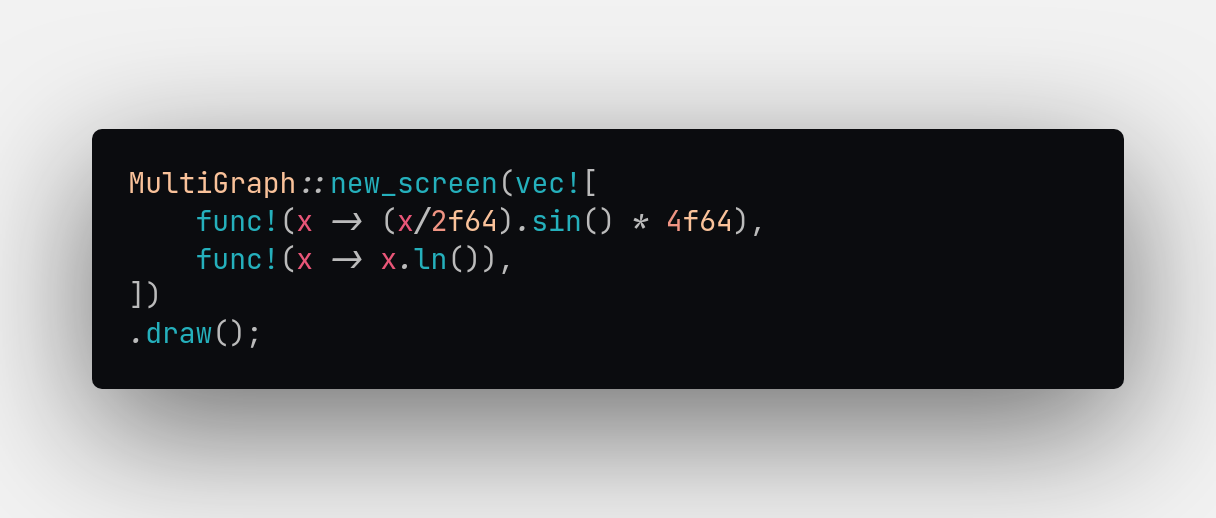
To write functions for the graph, a func! macro is provided, which provides a easy and simple syntax to create function instances easier and provide a more straightforward use of functions in MultiGraph (due to the fact that functions/closures with same types have different signatures, so you have to append as fn(X) -> Y, where X and Y are the types of the input and output, respectively).
To draw the the graph, it is as simple as calling .draw() on Graph or MultiGraph, and this will draw the graph to the terminal where the binary was executed. Another option that is available, is printing the instance, so if graph is your Graph or MultiGraph instance, println!("{}", graph) will print your graph to the screen too (note that debug print will not, just display print).
To customize how a graph is printed, you can use the GraphOptions with Graph or MultiGraphOptions, which is a simple tupple struct wrapping a Vec<GraphOptions> where each GraphOption is associated to the function in the same position in the passed functions vector, for MultiGraph. From here on, GraphOptions will be explained, as MultiGraphOptions currently only wraps the previous.
To customize the graph color, use the GraphOptions.color field, which holds a wrapper struct (tgraph::ColorWrapper) for the console_engine::Color enum, passing a console_engine::Color variant and calling .into() to easily convert it into the wrapper type. The character used is controlled with the tgraph::Character enum, which has a couple variants for predefined characters that we think fit good a graph representation and a variant to represent any character, that can easily be used by calling .into() in a char or manually selecting a variant. The last option is showing or hiding the y-axis legend, which currently is only supported in Graph under GraphOptions.height_legend (one of the reasons while config interface will soon change).
Both GraphOptions and MultiGraph implement Default, so you don't really have to worry about configuring it if not needed. GraphOptions also makes use of the typed_builder crate to offer a nice builder interface (for more info on it check the docs for the typed_builder crate).
Single function graph:
Graph::with_options_screen(
    func!(|x| 0.005 * (x * x) + 0.1 * x),
    GraphOptions::builder()
        .color(Color::DarkMagenta.into())
        .build(),
)
.draw();
Multiple function graph:
println!(
    "{}",
    MultiGraph::new(
        vec![
            func!(x -> 10f64 -(x/5f64)),
            func!(x -> f64::sin(x/2f64).abs() * 4f64),
            func!(x -> x.ln()),
        ],
        80,
        None,
    )
);
Comparing both examples, you can se the two ways to render the graph, as well as the different ways to declare a function using the func! macro.
You can run these example directly with
cargo run --example single_graph
# and
cargo run --example multi_graph