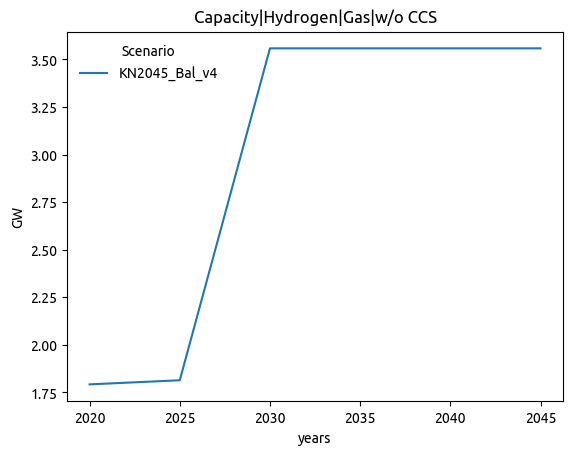
Force 5 GW of electrolysis in Germany in 2030 #233
Conversation
This file contains bidirectional Unicode text that may be interpreted or compiled differently than what appears below. To review, open the file in an editor that reveals hidden Unicode characters.
Learn more about bidirectional Unicode characters
f156d6a
to
7150913
Compare
for more information, see https://pre-commit.ci
Validator ReportI am the Validator. Download all artifacts here.
|
| NRMSE | Pearson | |
|---|---|---|
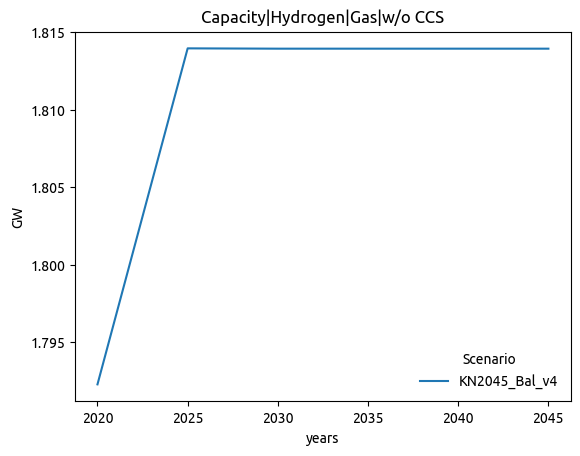
| Capacity|Hydrogen|Gas|w/o CCS | 0.806 | 0.638 |
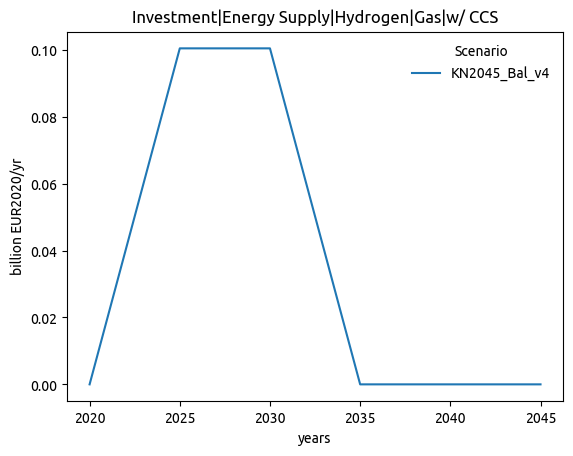
| Investment|Energy Supply|Hydrogen|Gas|w/ CCS | 0.692 | -0.316 |
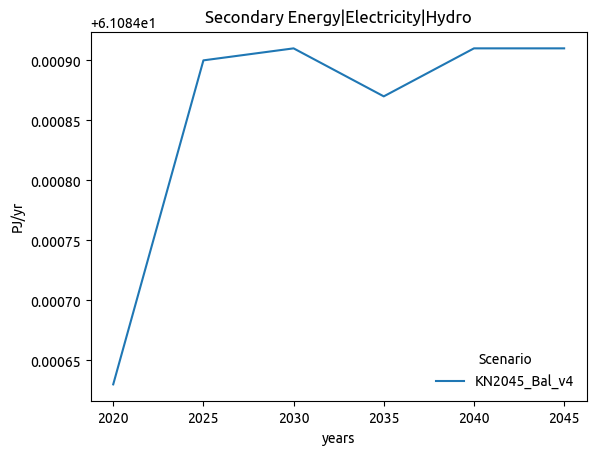
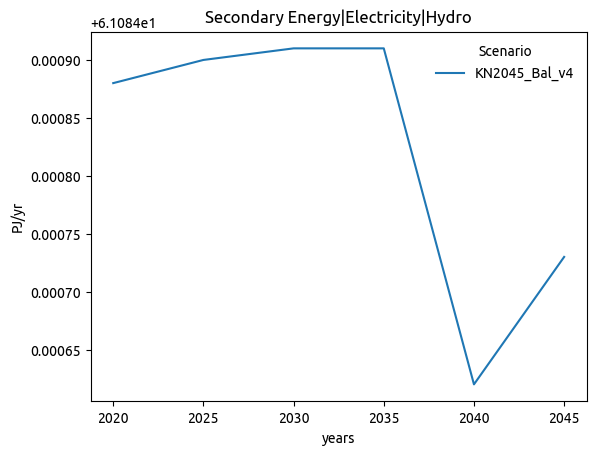
| Secondary Energy|Electricity|Hydro | 0.598 | -0.288 |
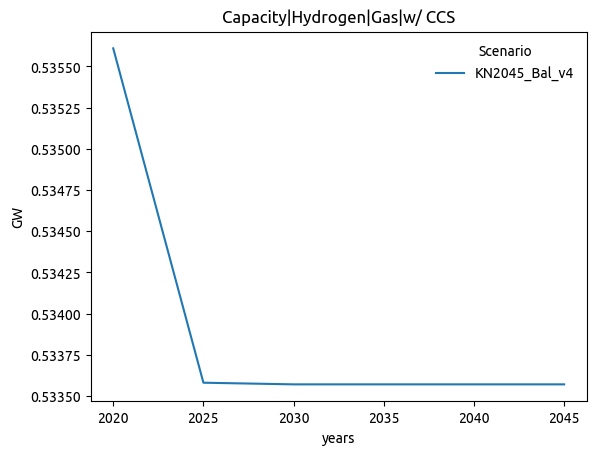
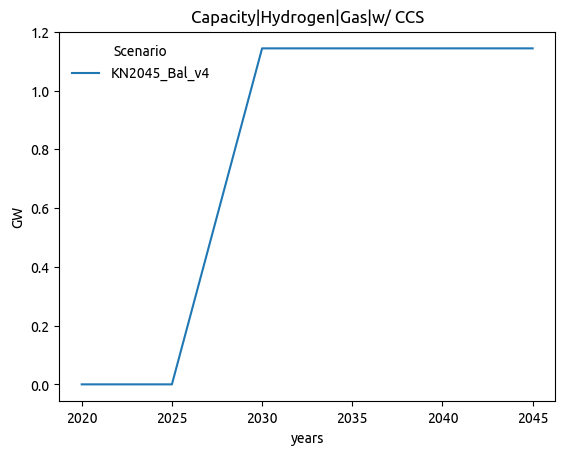
| Capacity|Hydrogen|Gas|w/ CCS | 0.512 | -0.636 |
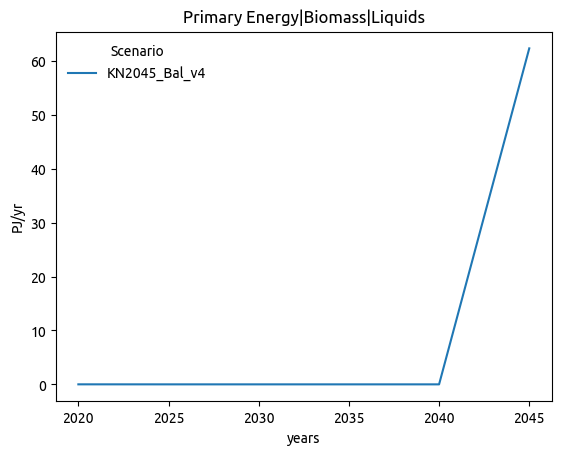
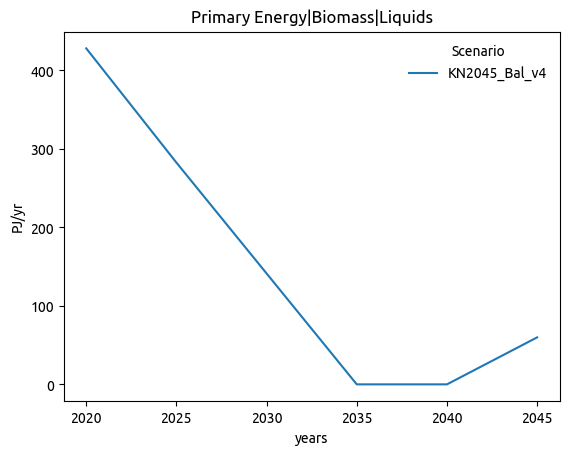
| Primary Energy|Biomass|Liquids | 0.507 | -0.262 |
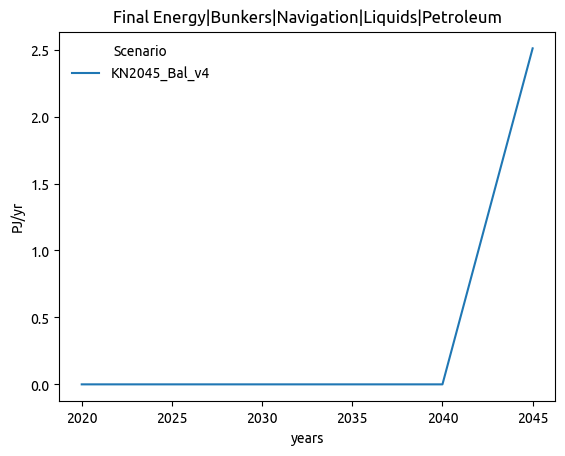
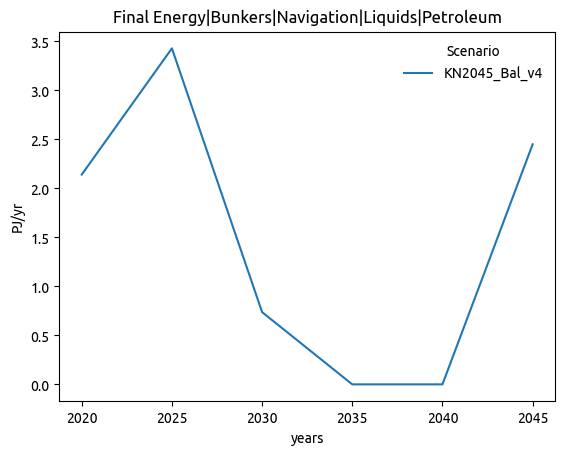
| Final Energy|Bunkers|Navigation|Liquids|Petroleum | 0.489 | 0.341 |
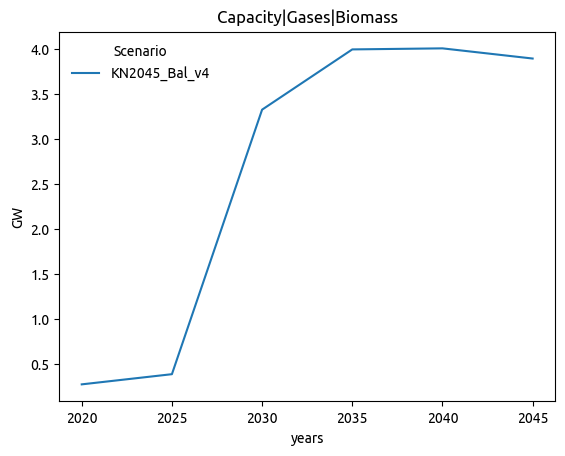
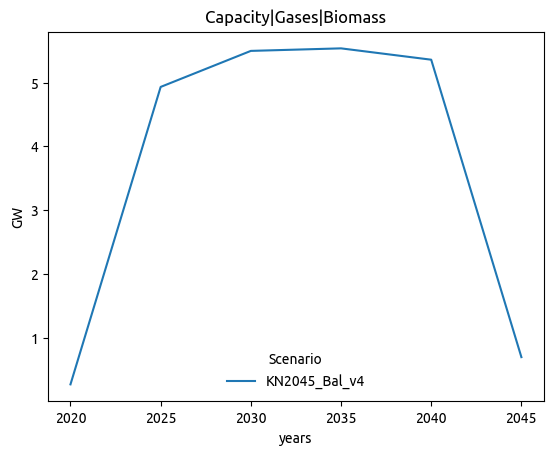
| Capacity|Gases|Biomass | 0.489 | 0.332 |
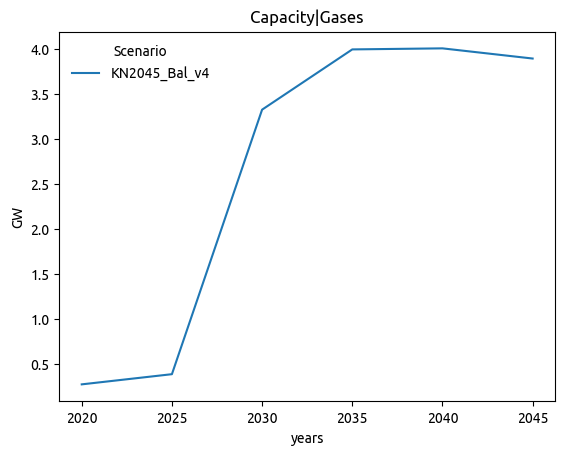
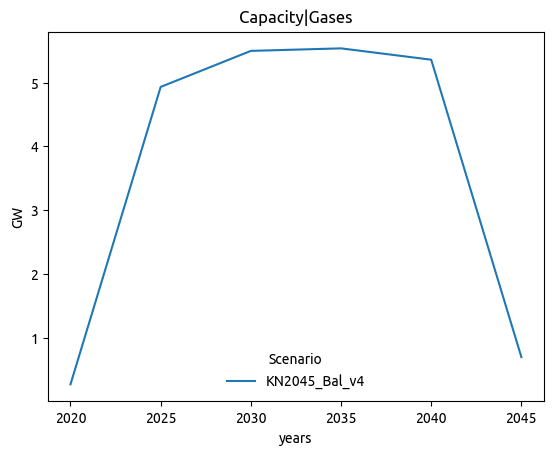
| Capacity|Gases | 0.489 | 0.332 |
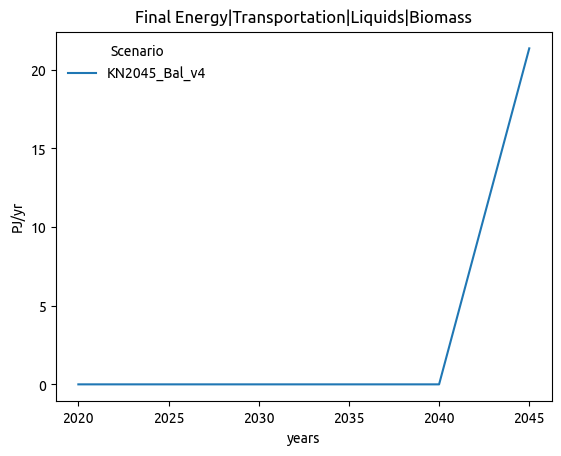
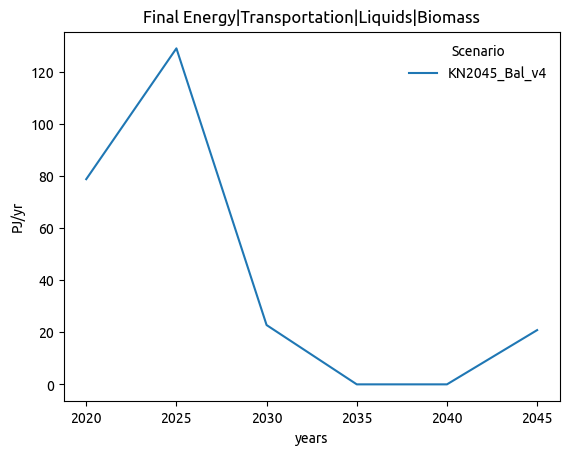
| Final Energy|Transportation|Liquids|Biomass | 0.484 | -0.200 |
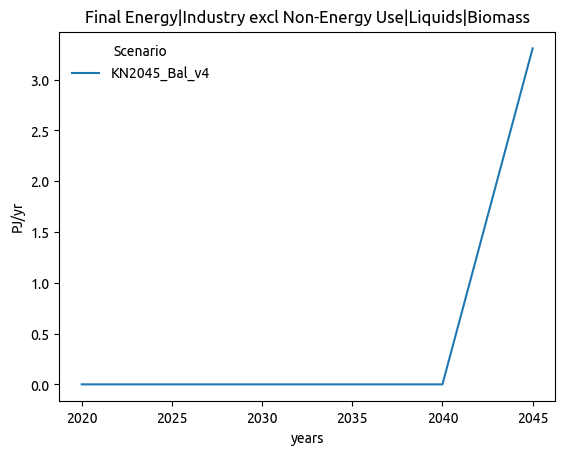
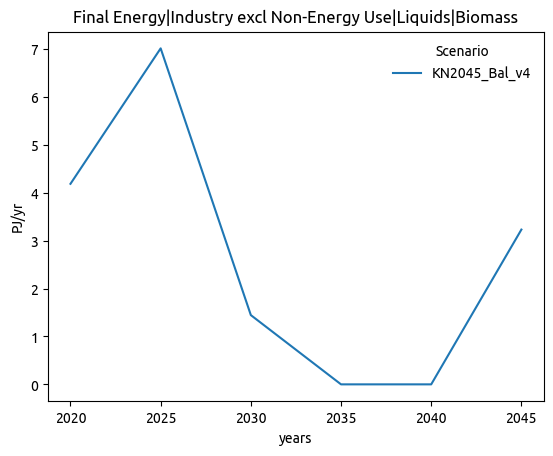
| Final Energy|Industry excl Non-Energy Use|Liquids|Biomass | 0.483 | 0.105 |
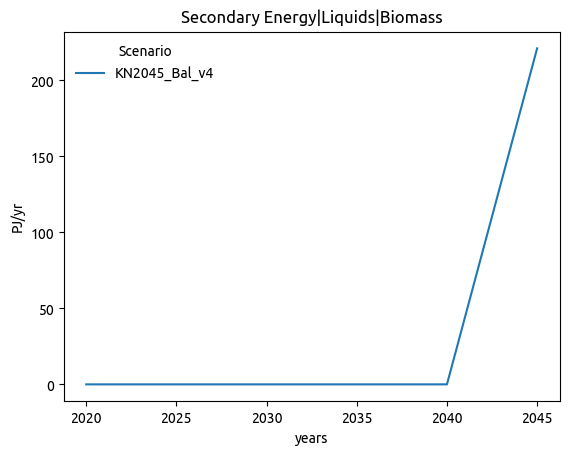
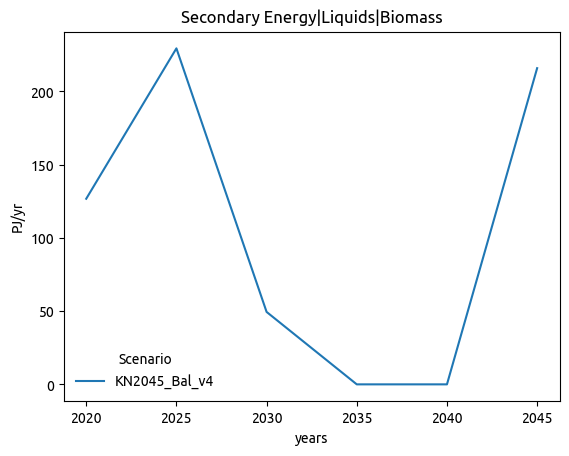
| Secondary Energy|Liquids|Biomass | 0.475 | 0.533 |
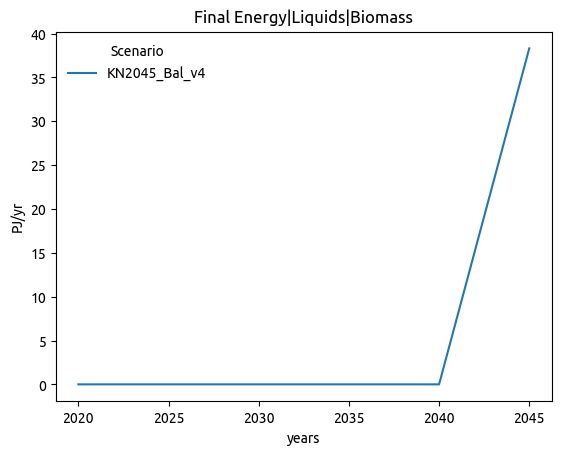
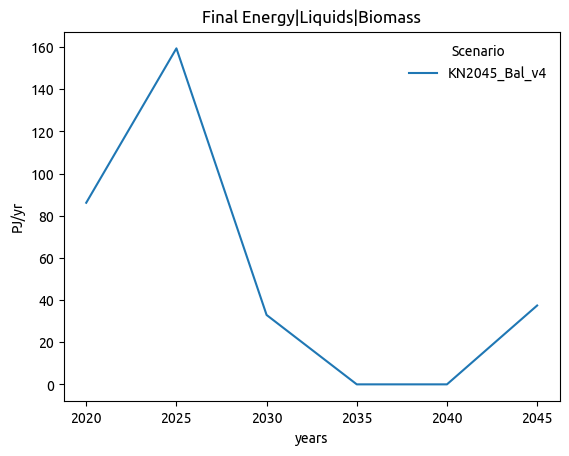
| Final Energy|Liquids|Biomass | 0.472 | -0.122 |
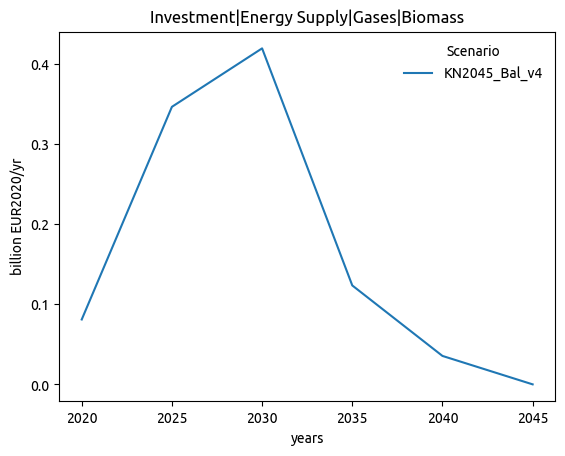
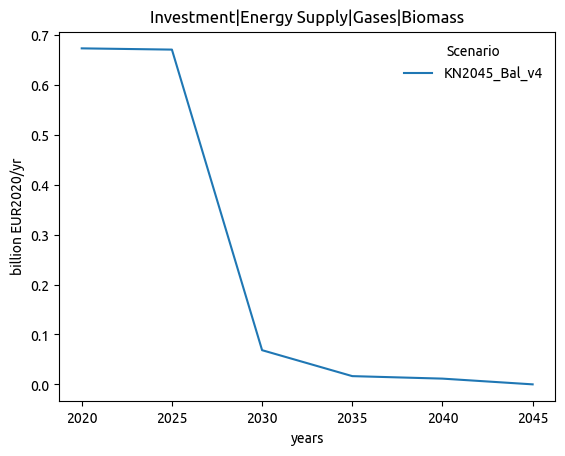
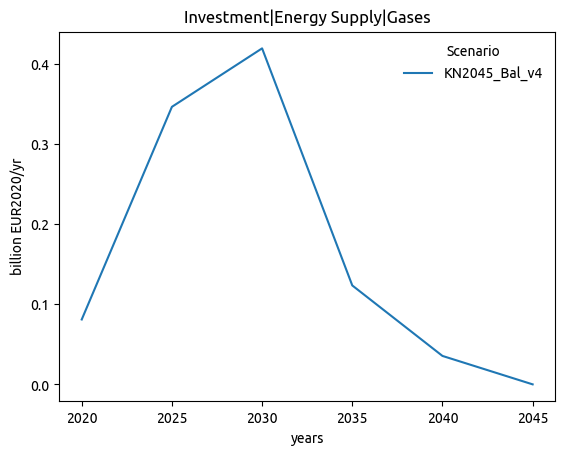
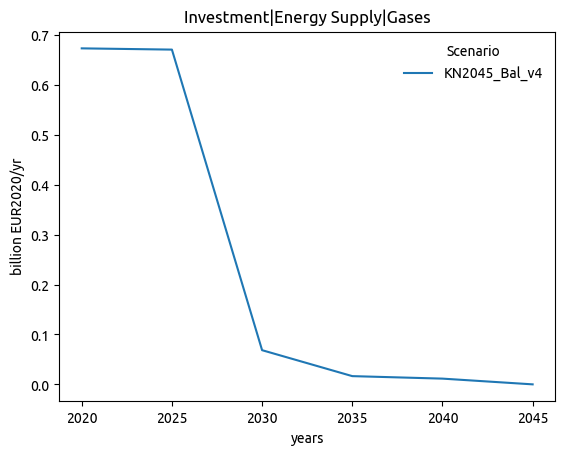
| Investment|Energy Supply|Gases|Biomass | 0.466 | 0.263 |
| Investment|Energy Supply|Gases | 0.466 | 0.263 |
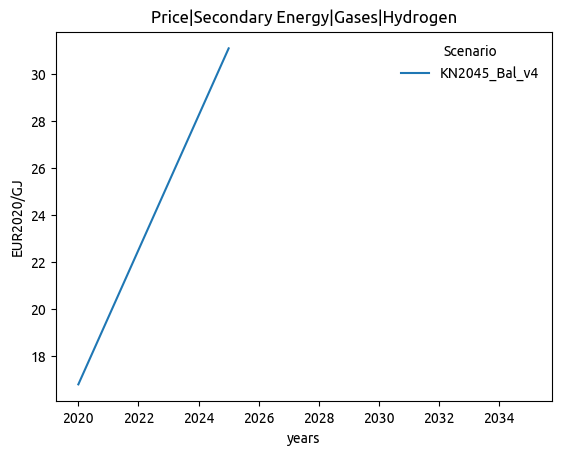
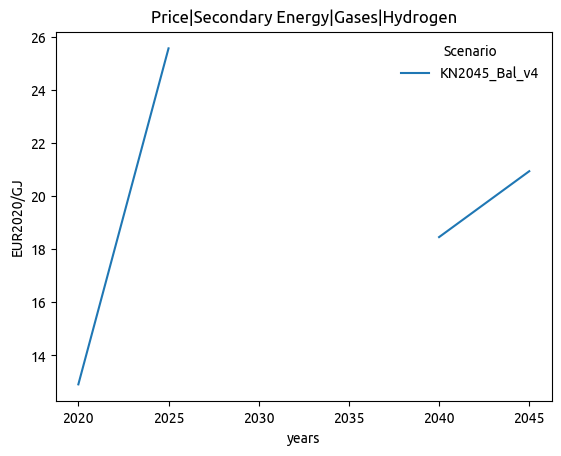
| Price|Secondary Energy|Gases|Hydrogen | 0.456 | 0.000 |
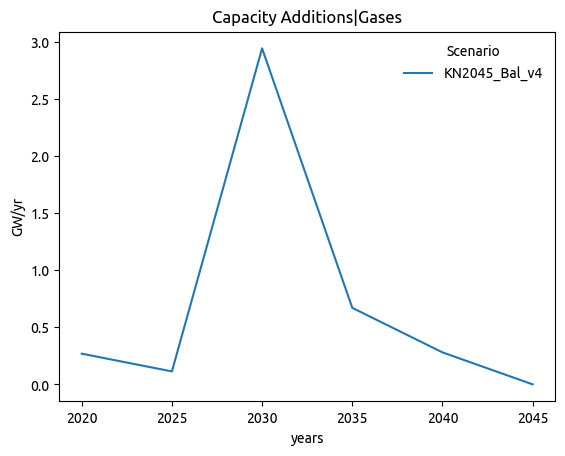
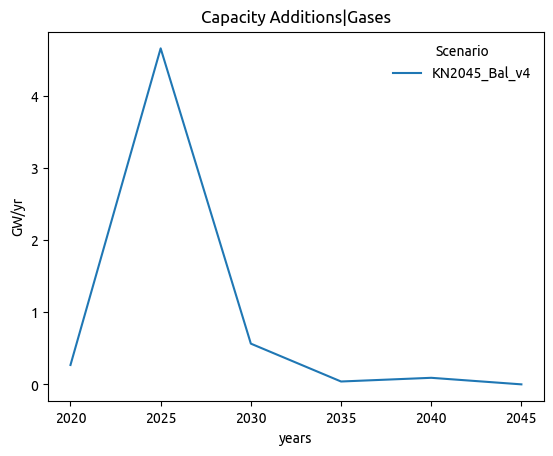
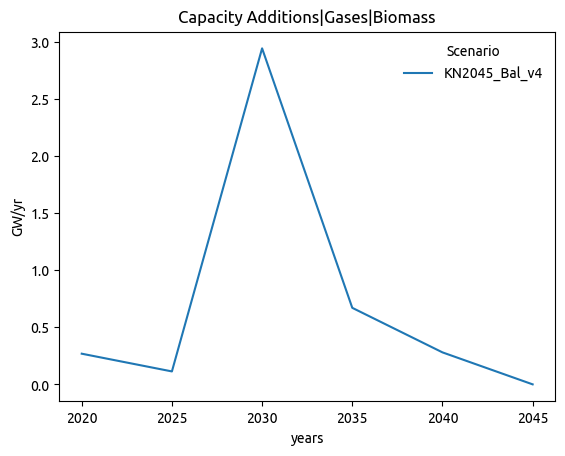
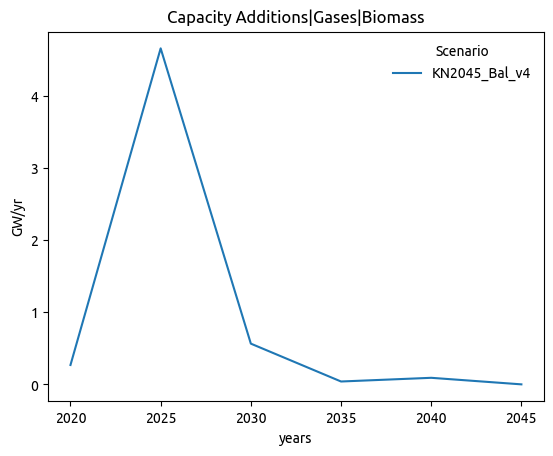
| Capacity Additions|Gases | 0.453 | -0.165 |
| Capacity Additions|Gases|Biomass | 0.453 | -0.165 |
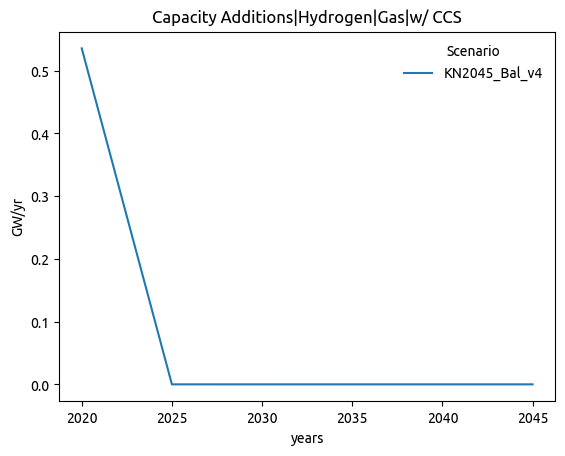
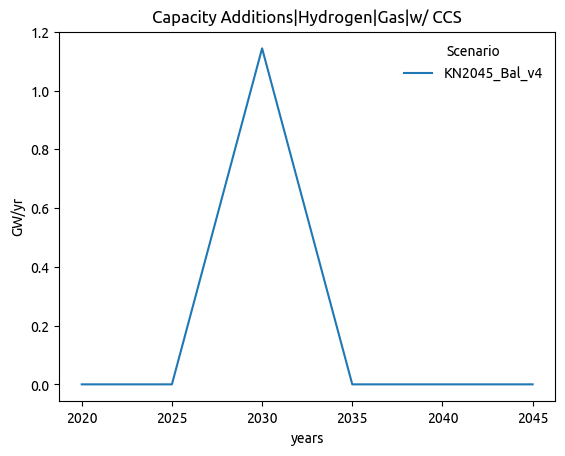
| Capacity Additions|Hydrogen|Gas|w/ CCS | 0.451 | -0.200 |
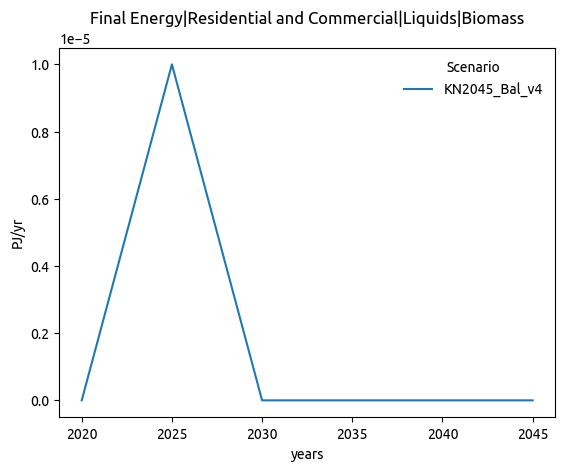
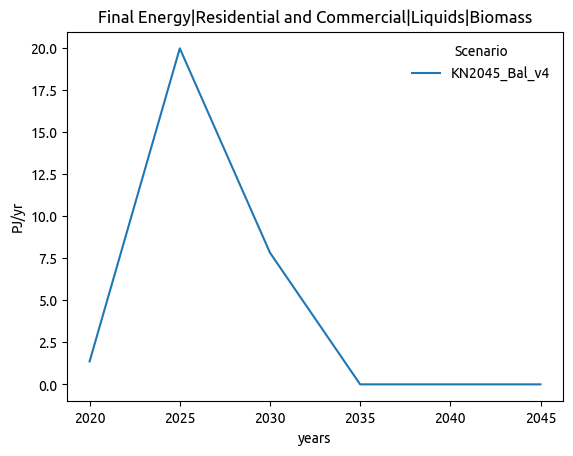
| Final Energy|Residential and Commercial|Liquids|Biomass | 0.439 | 0.925 |
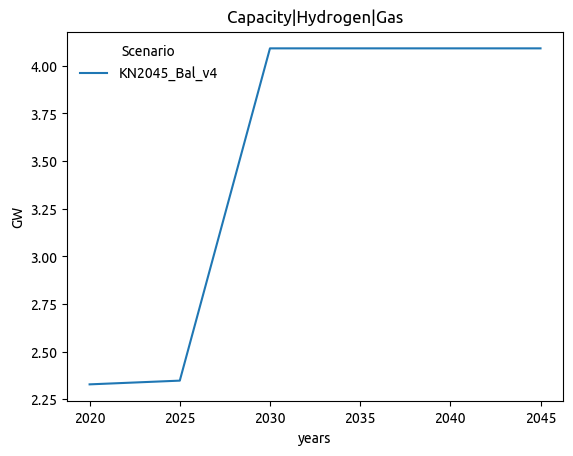
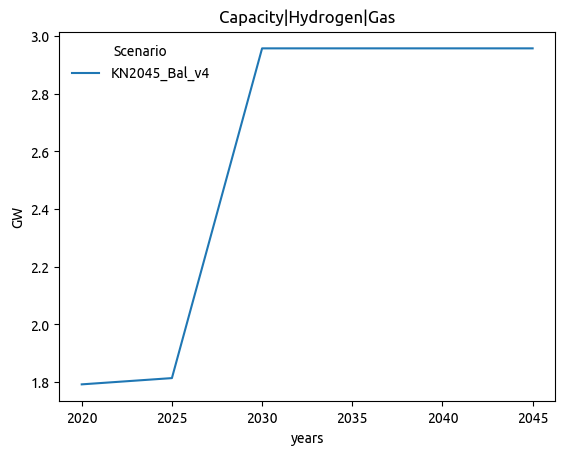
| Capacity|Hydrogen|Gas | 0.425 | 1.000 |
| Emissions|CO2|Energy|Supply|Gases | 0.407 | 0.353 |
| Capacity Additions|Hydrogen|Gas|w/o CCS | 0.397 | 0.643 |
| Primary Energy|Biomass|Gases | 0.397 | 0.389 |
| Capacity|Electricity|Gas|OC | 0.367 | 0.706 |
| Capacity|Electricity|Storage Converter | 0.365 | 0.445 |
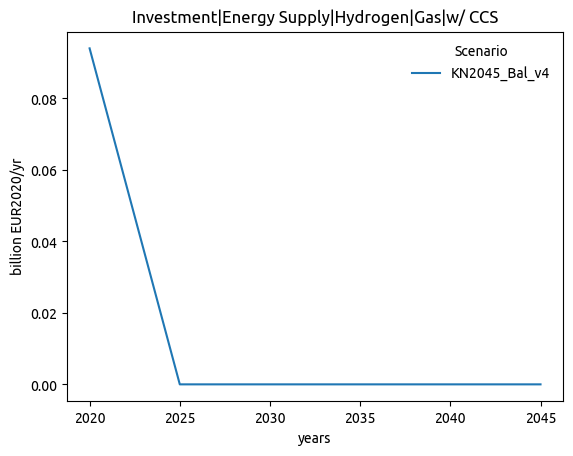
| Investment|Energy Supply|Hydrogen|Gas|w/o CCS | 0.280 | 0.811 |
| Investment|Energy Supply|Methanol | 0.260 | 0.852 |
| Emissions|CO2|Energy|Supply|Liquids and Gases | 0.249 | 0.849 |
| Trade|Secondary Energy|Methanol|Hydrogen|Gross Import|Volume | 0.245 | 0.816 |
| Trade|Secondary Energy|Methanol|Hydrogen|Volume | 0.227 | 0.848 |
| Final Energy|Industry|Liquids|Biomass | 0.222 | 0.882 |
| Price|Secondary Energy|Gases|Biomass | 0.217 | 0.854 |
| Emissions|Gross Fossil CO2|Energy|Supply|Hydrogen | 0.213 | 0.966 |
| Emissions|CO2|Energy|Supply|Hydrogen | 0.213 | 0.966 |
| Emissions|CO2|Efuels|Liquids | 0.202 | 0.930 |
| Final Energy|Non-Energy Use|Liquids|Biomass | 0.195 | 0.909 |
| Capacity Additions|Hydrogen|Electricity | 0.190 | 0.869 |
| Secondary Energy|Electricity|Biomass|Gaseous and Liquid | 0.189 | 0.000 |
| Investment|Energy Supply|Hydrogen|Electricity | 0.187 | 0.894 |
| Secondary Energy|Methanol | 0.180 | 0.968 |
| Capacity Additions|Hydrogen | 0.167 | 0.883 |
| Capacity|Methanol | 0.167 | 0.972 |
| Capacity|Hydrogen|Electricity | 0.162 | 0.968 |
| Final Energy|Bunkers|Aviation|Liquids|Petroleum | 0.157 | 0.942 |
| Capacity Additions|Heat|Gas | 0.153 | 0.899 |
| Secondary Energy|Hydrogen|Gas | 0.144 | 0.997 |
| Capacity Additions|Hydrogen|Gas | 0.141 | 0.996 |
| Secondary Energy Input|Electricity|Hydrogen | 0.140 | 0.965 |
| Primary Energy|Gas|Hydrogen | 0.137 | 0.999 |
| Secondary Energy|Hydrogen|Electricity | 0.136 | 0.967 |
| Investment|Energy Supply|Electricity|Transmission|Offwind-AC | 0.134 | 0.967 |
| Investment|Energy Supply|Heat|Processes | 0.131 | 0.954 |
| Investment|Energy Supply|Heat|Gas | 0.128 | 0.944 |
| Emissions|CO2|Energy|Supply|Liquids | 0.126 | 0.983 |
| Investment|Energy Supply|Hydrogen | 0.124 | 0.940 |
| Investment|Energy Supply|Hydrogen|Gas | 0.117 | 0.997 |
| Capacity|Heat|Processes | 0.115 | 0.991 |
| Trade|Secondary Energy|Gases|Biomass|Volume | 0.113 | 0.946 |
| Secondary Energy|Hydrogen | 0.108 | 0.979 |
| Capacity Additions|Methanol | 0.107 | 0.962 |
| Secondary Energy|Heat|Other | 0.106 | 0.987 |
| Capacity Additions|Heat|Processes | 0.101 | 0.965 |
| Price|Secondary Energy|Liquids | 0.101 | 0.972 |
NRMSE: Normalized (combined-min-max) Root Mean Square Error
Pearson: Pearson correlation coefficient
Threshold: NRMSE > 0.1
Only variables reaching the threshold are shown. Find the equivalent plot for all of them below.
Plots
| Main branch | Feature branch |
|---|---|
 |
 |
 |
 |
 |
 |
 |
 |
 |
 |
 |
 |
 |
 |
 |
 |
 |
 |
 |
 |
 |
 |
 |
 |
 |
 |
 |
 |
 |
 |
 |
 |
 |
 |
 |
 |
 |
 |
 |
 |
General
Plots comparison
| Main branch | Feature branch |
|---|---|
 |
 |
 |
 |
 |
 |
 |
 |
 |
 |
 |
 |
Files comparison
| Status | NRMSE | MAE (norm) | |
|---|---|---|---|
| csvs/metrics.csv | 0.003 | 0.06 | |
| csvs/curtailment.csv | 0.000 | 0.10 | |
| csvs/price_statistics.csv | 0.007 | 0.21 | |
| csvs/cumulative_cost.csv | 0.002 | 0.15 | |
| csvs/nodal_cfs.csv | |||
| csvs/nodal_supply_energy.csv | |||
| csvs/nodal_costs.csv | |||
| csvs/nodal_capacities.csv | |||
| csvs/cfs.csv | |||
| csvs/market_values.csv | ✅ Almost equal | 0.023 | 0.03 |
| csvs/supply.csv | ✅ Almost equal | 0.002 | 0.02 |
| csvs/prices.csv | ✅ Almost equal | 0.000 | 0.01 |
| csvs/costs.csv | ✅ Almost equal | 0.003 | 0.00 |
| csvs/capacities.csv | ✅ Almost equal | 0.004 | 0.01 |
| csvs/supply_energy.csv | ✅ Almost equal | 0.002 | 0.02 |
| csvs/energy.csv | ✅ Almost equal | 0.001 | 0.01 |
| csvs/weighted_prices.csv | ✅ Equal |
NRMSE: Normalized (combined-min-max) Root Mean Square Error
MAE (norm): Mean Absolute Error on normalized data (min-max)
Status Threshold: MAE (norm) > 0.05 and NRMSE > 0.3
Model Metrics
Benchmarks
Comparing force_electrolysis_cap (67223c5) with main (7d9d9b4).
Branch is 2 commits ahead and 0 commits behind.
Last updated on 2024-10-10 18:35:56 CEST.
Sign up for free
to join this conversation on GitHub.
Already have an account?
Sign in to comment
Add this suggestion to a batch that can be applied as a single commit.
This suggestion is invalid because no changes were made to the code.
Suggestions cannot be applied while the pull request is closed.
Suggestions cannot be applied while viewing a subset of changes.
Only one suggestion per line can be applied in a batch.
Add this suggestion to a batch that can be applied as a single commit.
Applying suggestions on deleted lines is not supported.
You must change the existing code in this line in order to create a valid suggestion.
Outdated suggestions cannot be applied.
This suggestion has been applied or marked resolved.
Suggestions cannot be applied from pending reviews.
Suggestions cannot be applied on multi-line comments.
Suggestions cannot be applied while the pull request is queued to merge.
Suggestion cannot be applied right now. Please check back later.
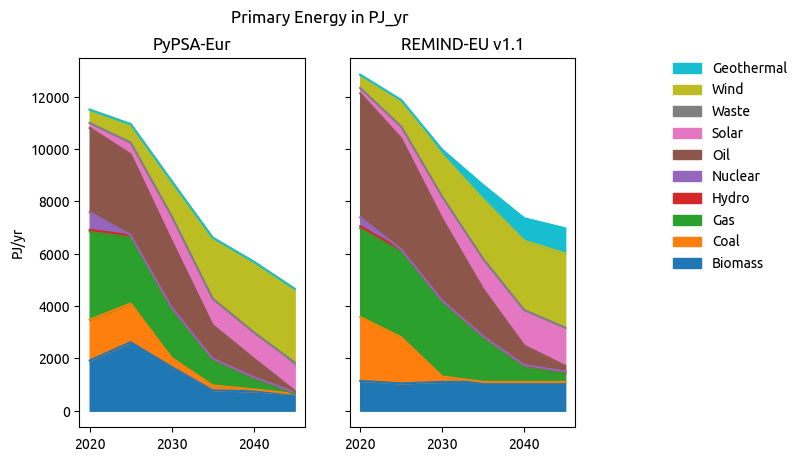
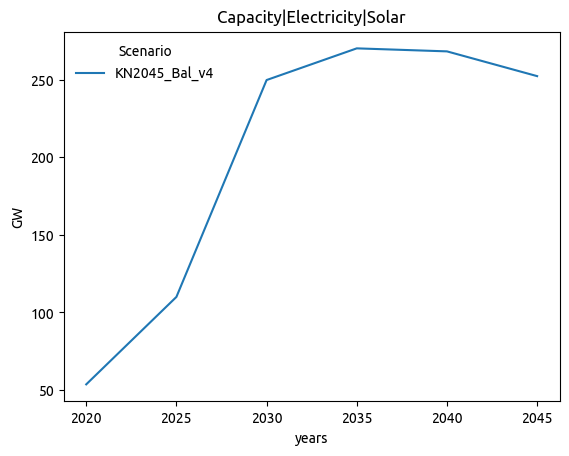
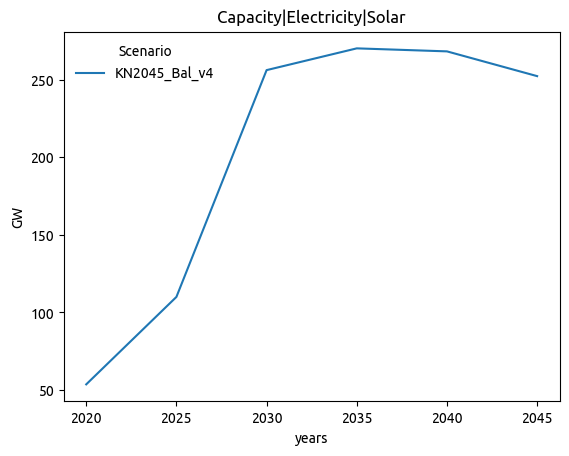
Since the German government adjusted the goals for installed capacity of electrolysis units, this PR adds the boundary condition to have at least 5GW installed by 2030.

In a coarse resolution run the following development of installed capacity is observed:
Before asking for a review for this PR make sure to complete the following checklist:
ariadne_allcompletes without errorsexport_ariadne_variableshas been adapted to the changesChangelog.mdmainhas been merged into the PRYYYYMMDDdescriptive_title