Python program to generate power network model for calculating geomagnetically induced currents.
The program handles different types of transformers (Auto and two-winding), and multiple transformers per substation. It connects correctly between voltage systems. In addition, parallel connections between substations are handled.
Uses the approach outlined here.
This code appears in a manuscript that is published in the AGU Space Weather Journal.
pip install power_network_modelExample data is given in the accompanying '/Data/' folder. If you have two .csv files with network information- one for connections, one for transformers:
import pkg_resources
import power_network_model as PNM
import power_network_model.plotter as PNMplot

# read in transformer file, generate substation data:
trafo_filename = pkg_resources.resource_filename("power_network_model", 'Data/Horton_Input_Trafos.csv')
ss_trafos, ss_connections, ss_meta = PNM.make_substations(trafo_filename)

# Generate connections between substations:
connections_filename = pkg_resources.resource_filename("power_network_model", 'Data/Horton_Input_Connections.csv')
connections_twixt_stations = PNM.connections_adder(connections_filename, ss_meta)

# Write out the output files
filename = "Horton_Output"
nodes_output, connections_output = PNM.write_out(filename, ss_trafos, ss_connections, connections_twixt_stations)

################################################################################
# If you want to plot the output:
PNMplot.network_plotter(nodes_output, connections_output, ["red", "blue"], "Horton Model")
The above gives you the following model:

The connections at one substation in this model are shown here:
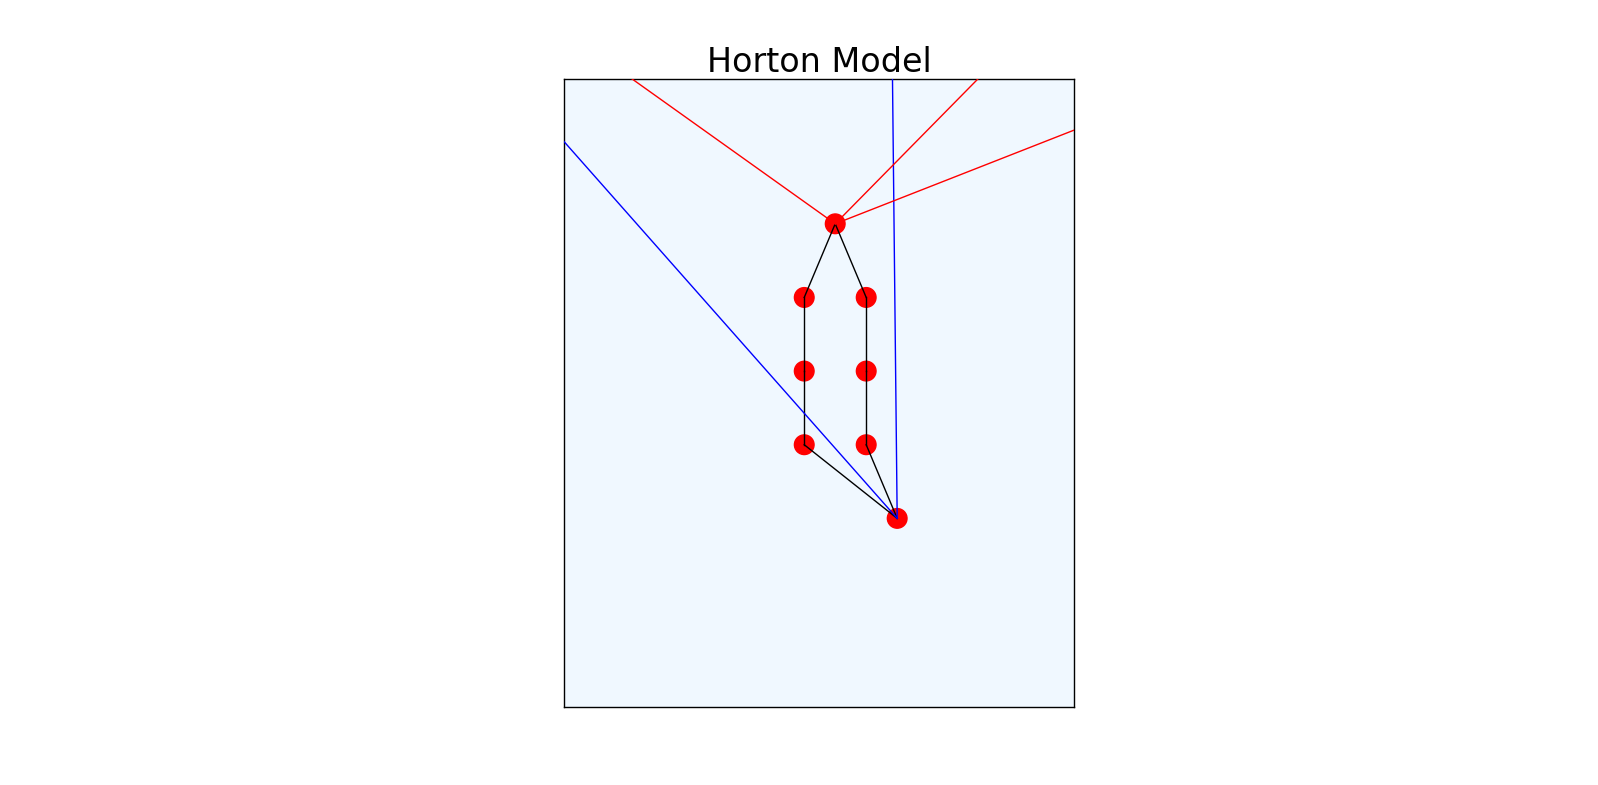 With red, blue and black lines for 500 kV, 345 kV and internal connections respectively. This substation connects two voltage regimes, and has two YY-transformers (3 nodes apiece).
The two .csv file inputs need to be in the following format:
Transformer information in a csv file with columns:
- SS_NAME = Subsation name (important to keep spelling uniform)
- SS_SYM = Substation symbol
- TF_SYM = Transformer symbol (or code: e.g, T1432)
- VOLTAGE = Highest operating voltage of the substation
- LAT = Latitude
- LON = Longitude
- TYPE = Type of transformer: 'A' = autotransformer, "YY" = Wye-Wye, "G" = grounded, "T" = Tee connection station.
- RES1 = High voltage resistance winding
- RES2 = Low voltage resistance winding
- GROUND = Ground resistance at substation
- SWITCH = Transformer ground switch: 0 = None, 1 = Open, 2 = Closed
Connections information in a csv file with columns:
- FROM = Substation name from
- TO = Substation name to
- VOLTAGE = Voltage of connection
- CIRCUIT = To denote multiple lines per connection
- RES = Resistance of line.
Two .txt files are output, one for node information, and one for connections.
Nodes file has columns (left-to-right):
- Node number
- Substation latitude
- Substation longitude
- Transformer winding resistance
- Grounding resistance
- Voltage of node
- Substation ID
- Transformer ID
- Real (0) or imaginary (nan) node
Connections file has columns (left-to-right):
- Number of node from
- Number of node to
- Resistance of connection
- Latitude of node from
- Longitude of node from
- Latitude of node to
- Longitude of node to
- Dummy coluimn (with nans)
- Voltage of Line
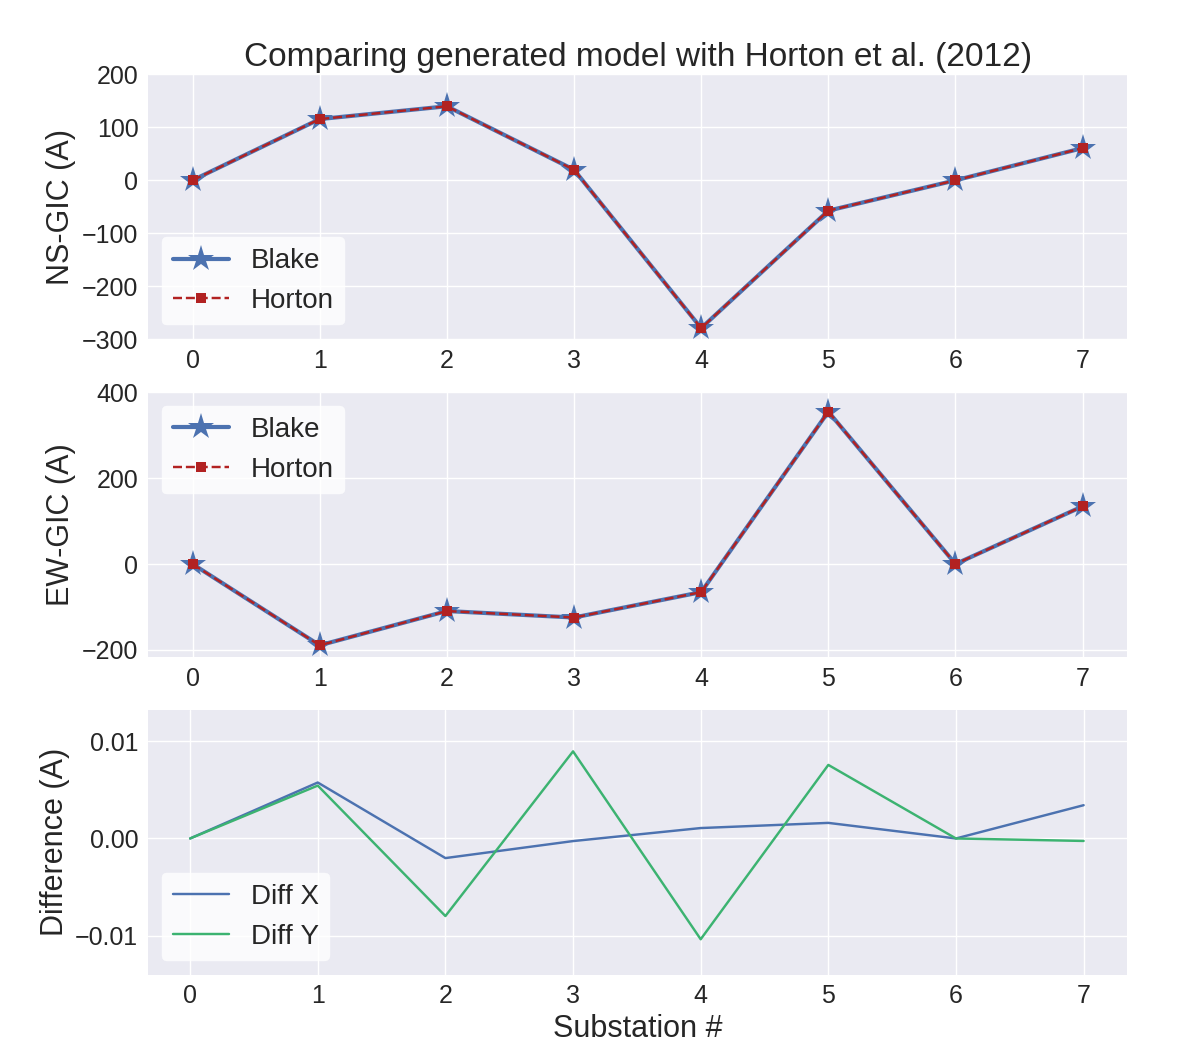
Verified with the Horton 2012 model (included in Data/).
After calculating GICs for a uniform electric field, compared to Horton:
Finally, when applied to a larger network such as Ireland:

Written by Sean Blake in Trinity College Dublin, 2017
Email: [email protected]
GITHUB: https://github.com/TerminusEst
Uses the MIT license.