The Big Mart Sales Prediction project is a Python-based solution aimed at forecasting sales for Big Mart retail stores using historical sales data provided in a CSV format. This project employs various machine learning regression models to enhance prediction accuracy.
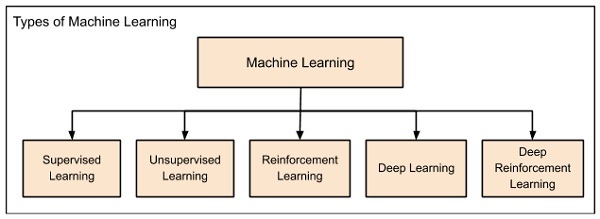
Machine learning is a subfield of artificial intelligence that focuses on the development of algorithms capable of learning from data and making predictions or decisions. It enables computers to learn and improve from experience without being explicitly programmed.
Consider the following figure that shows a plot of house prices versus its size in sq. ft.
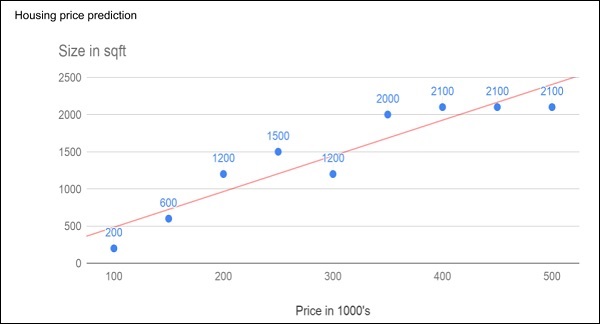
After plotting various data points on the XY plot, we draw a best-fit line to do our predictions for any other house given its size. You will feed the known data to the machine and ask it to find the best fit line. Once the best fit line is found by the machine, you will test its suitability by feeding in a known house size, i.e. the Y-value in the above curve. The machine will now return the estimated X-value, i.e. the expected price of the house. The diagram can be extrapolated to find out the price of a house which is 3000 sq. ft. or even larger. This is called regression in statistics. Particularly, this kind of regression is called linear regression as the relationship between X & Y data points is linear.
In many cases, the relationship between the X & Y data points may not be a straight line, and it may be a curve with a complex equation. Your task would be now to find out the best fitting curve which can be extrapolated to predict the future values.
You will use the statistical optimization techniques to find out the equation for the best fit curve here. And this is what exactly Machine Learning is about. You use known optimization techniques to find the best solution to your problem.


.png)
There are two main categories of supervised learning that are mentioned below:
Classification deals with predicting categorical target variables, which represent discrete classes or labels. For instance, classifying emails as spam or not spam, or predicting whether a patient has a high risk of heart disease. Here are some classification algorithms:
Logistic Regression Support Vector Machine Random Forest Decision Tree K-Nearest Neighbors (KNN) Naive Bayes
Regression models are a type of machine learning algorithm used for predicting continuous numerical values based on input features. Here are some regression algorithms:
Linear Regression Polynomial Regression Ridge Regression Lasso Regression Decision tree Random Forest
Decision trees are versatile algorithms that use a tree-like model of decisions and their possible consequences. They are effective for both classification and regression tasks, particularly in dealing with complex datasets and non-linear relationships.
Decision trees are created by recursively partitioning the data into smaller and smaller subsets. At each partition, the data is split based on a specific feature, and the split is made in a way that maximizes the information gain.
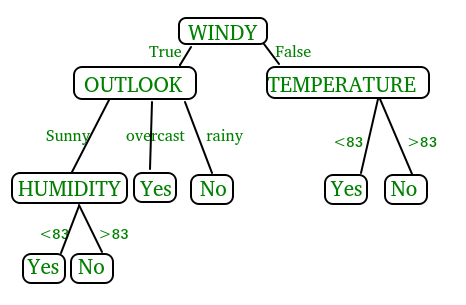
In the above figure, decision tree is a flowchart-like tree structure that is used to make decisions. It consists of Root Node(WINDY), Internal nodes(OUTLOOK, TEMPERATURE), which represent tests on attributes, and leaf nodes, which represent the final decisions. The branches of the tree represent the possible outcomes of the tests.
- Decision trees are used in various fields such as finance for credit scoring, healthcare for medical diagnosis, and marketing for customer segmentation.
- They are effective for both classification and regression tasks, making them versatile for a wide range of predictive modeling applications.
- Interpretability: Decision trees provide a clear and interpretable representation of the decision-making process, making it easier to understand the model's logic.
- No Assumptions about Data Distribution: Decision trees do not make assumptions about the distribution of the data, making them robust to different types of datasets.
- Handles Non-Linear Relationships: Decision trees can capture complex, non-linear relationships within the data.
- Overfitting: Decision trees are prone to overfitting, especially on small datasets. This can lead to poor generalization performance on unseen data.
- Instability: Small changes in the data can result in a completely different tree structure, leading to model instability.
- Biased towards Dominant Classes: In classification tasks with imbalanced classes, decision trees may be biased towards the dominant class.
Random Forest is an ensemble learning method that combines multiple decision trees to make more accurate predictions. It excels in handling high-dimensional data and reducing overfitting.
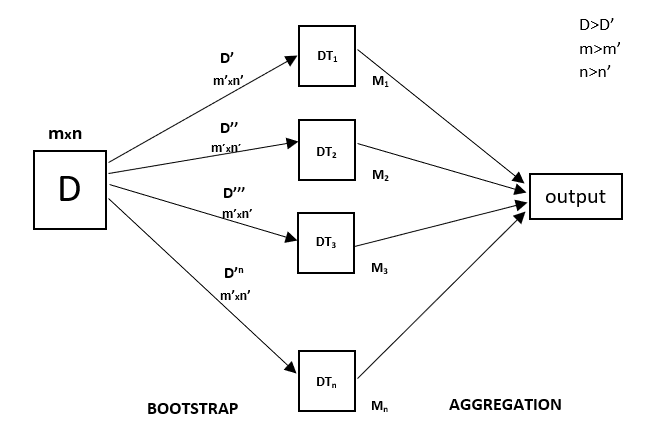
Every decision tree has high variance, but when we combine all of them in parallel then the resultant variance is low as each decision tree gets perfectly trained on that particular sample data, and hence the output doesn’t depend on one decision tree but on multiple decision trees. In the case of a classification problem, the final output is taken by using the majority voting classifier. In the case of a regression problem, the final output is the mean of all the outputs. This part is called Aggregation
- Random Forest is widely used in applications like finance for fraud detection, healthcare for disease prediction, and remote sensing for image classification.
- It is particularly useful when dealing with high-dimensional data and complex relationships.
- High Accuracy: Random Forest generally provides higher accuracy compared to individual decision trees by reducing overfitting and increasing robustness.
- Feature Importance: It can rank the importance of features, helping in feature selection and providing insights into the dataset.
- Reduces Overfitting: The ensemble nature of Random Forest helps in reducing overfitting compared to a single decision tree.
- Computational Complexity: Training a large number of trees can be computationally expensive and time-consuming.
- Less Interpretability: While Random Forest can provide feature importance, the overall model is less interpretable compared to a single decision tree.
- May Overfit on Noisy Data: Random Forest can still overfit on noisy datasets, although to a lesser extent than individual decision trees.
Logistic regression is a statistical model used for binary classification tasks. It estimates the probability of an event occurring based on input variables and finds applications in healthcare, finance, and social sciences.
The sigmoid function is a mathematical function used to map the predicted values to probabilities. It maps any real value into another value within a range of 0 and 1. The value of the logistic regression must be between 0 and 1, which cannot go beyond this limit, so it forms a curve like the “S” form. The S-form curve is called the Sigmoid function or the logistic function. In logistic regression, we use the concept of the threshold value, which defines the probability of either 0 or 1. Such as values above the threshold value tends to 1, and a value below the threshold values tends to 0.
On the basis of the categories, Logistic Regression can be classified into three types:
In binomial Logistic regression, there can be only two possible types of the dependent variables, such as 0 or 1, Pass or Fail, etc.
In multinomial Logistic regression, there can be 3 or more possible unordered types of the dependent variable, such as “cat”, “dogs”, or “sheep”
In ordinal Logistic regression, there can be 3 or more possible ordered types of dependent variables, such as “low”, “Medium”, or “High”.
- Logistic Regression is commonly used in binary classification problems, such as spam detection, credit scoring, and medical diagnosis.
- It is widely applied in fields where understanding the probability of an event occurring is crucial.
- Simple and Fast: Logistic Regression is computationally efficient and easy to implement, making it suitable for large datasets.
- Probabilistic Output: Provides probabilities for different classes, allowing for easy interpretation of results.
- Linear Separation: Works well when the decision boundary between classes is approximately linear.
- Assumes Linearity: Logistic Regression assumes a linear relationship between the features and the log-odds of the response variable. It may not perform well when the relationship is non-linear.
- Sensitive to Outliers: Outliers can significantly influence the parameter estimates and affect the performance of Logistic Regression.
- Limited Expressiveness: Logistic Regression may not capture complex relationships in the data compared to more flexible models like decision trees.
K-Nearest Neighbors (KNN) is a simple yet effective algorithm used for classification and regression tasks. It assigns a new data point to a class or predicts the value based on the majority vote or average of its k nearest neighbors in the feature space.
Thе K-Nearest Neighbors (KNN) algorithm operates on the principle of similarity, where it predicts the label or value of a new data point by considering the labels or values of its K nearest neighbors in the training dataset.
.png)
- KNN is widely used in recommendation systems, pattern recognition, and anomaly detection.
- It is effective for both classification and regression tasks, making it versatile for various domains such as healthcare, finance, and image recognition.
- Simplicity: KNN is easy to understand and implement, making it a good choice for quick prototyping.
- No Training Phase: KNN does not have a separate training phase; it memorizes the entire dataset, making it adaptive to changes.
- Non-Parametric: KNN is a non-parametric algorithm, meaning it makes no assumptions about the underlying data distribution.
- Computational Cost: Predictions can be computationally expensive, especially with large datasets, as it requires calculating distances to all data points.
- Sensitive to Outliers: Outliers can significantly affect predictions since they impact the distance calculation.
- Need for Optimal K: The choice of the number of neighbors (K) is critical and can impact the performance of the model.
Linear regression is widely used for regression tasks, where the goal is to predict a continuous numerical value. It models the relationship between input variables and the target variable using a linear equation, making it suitable for simple linear relationships.
There are two main types of linear regression:
This involves predicting a dependent variable based on a single independent variable.
This involves predicting a dependent variable based on multiple independent variables.
- Linear Regression is widely used in finance for predicting stock prices, economics for demand forecasting, and healthcare for predicting patient outcomes.
- It is suitable for scenarios where a linear relationship is assumed between the input features and the target variable.
- Interpretability: Linear Regression provides a straightforward interpretation of the relationship between each feature and the target variable.
- Computational Efficiency: Training and making predictions with linear regression are computationally efficient, especially with a large number of features.
- Well-Suited for Simple Relationships: Linear Regression performs well when the relationship between the input features and the target variable is approximately linear.
- Assumes Linearity: Linear Regression assumes a linear relationship between the input features and the target variable, which may not hold for complex relationships.
- Sensitive to Outliers: Outliers can disproportionately influence the model parameters and affect the accuracy of predictions.
- Limited Expressiveness: Linear Regression may not capture non-linear relationships in the data effectively, leading to suboptimal performance in some cases.
Each algorithm has its strengths and weaknesses, and the choice depends on the specific problem, data characteristics, and desired performance metrics. Consider factors like interpretability, computational efficiency, accuracy, and complexity when selecting the appropriate algorithm.
Feel free to explore and modify the code to experiment with different algorithms and improve prediction accuracy.