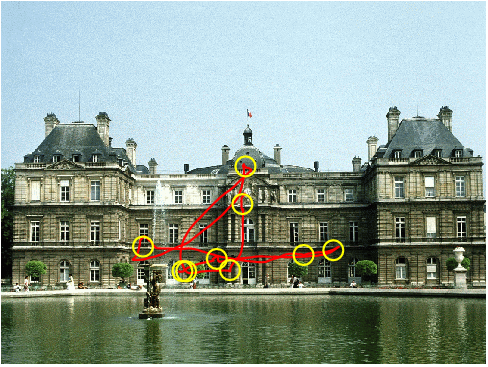
Project code and data associated with Hu_etal '17 CISS paper on head movements in virtual reality
The program is written in MATLAB (Mathworks). The code is known to run on R2014a, but should also be compatible with other versions. The main program function is plot_figs.m. Running this program will generate the figures shown in the paper. If you use the associated code and/or data, please cite:
@InProceedings{Hu_etal17a,
    Title                    = {Head movements during visual exploration of natural images in virtual reality},
    Author                   = {Hu, Brian and Johnson-Bey, Ishmael and Sharma, Mansi and Niebur, Ernst},
    Booktitle                = {IEEE CISS-2017 51st Annual Conference on Information Sciences and Systems},
    Year                     = {2017},
    Address                  = {Baltimore, MD},
    Organization             = {IEEE Information Theory Society},
    Pages                    = {1-6},
}
The set of natural images used in the experiment can be found in the images directory. We used a total of 125 images, with 25 images from each of five categories: buildings (images 0-24), fractals (images 25-49), old home interiors (images 50-74), landscapes (images 75-99), and new home interiors (images 100-124). With the exception of the new home interiors, the images used in the other four categories are a subset of those used in previous visual attention studies on eye fixations (Parkhurst et al, '02) and interest point selections (Masciocchi et al, '09). These references are given below:
@Article{Parkhurst_etal02a,
    Title                    = {{M}odelling the role of salience in the allocation of visual selective attention},
    Author                   = {Parkhurst, Derrick and Law, Klinton and Niebur, Ernst},
    Journal                  = {Vision Research},
    Year                     = {2002},
    Number                   = {1},
    Pages                    = {107-123},
    Volume                   = {42}
}

@Article{Masciocchi_etal09,
    Title                    = {{E}veryone knows what is interesting: {S}alient locations which should be fixated},
    Author                   = {Masciocchi, Christopher M. and Mihalas, Stefan and Parkhurst, Derrick and Niebur, Ernst},
    Journal                  = {Journal of Vision},
    Year                     = {2009},
    Month                    = {October},
    Note                     = {PMC 2915572},
    Number                   = {11},
    Pages                    = {1-22},
    Volume                   = {9}
}
The raw head movement data is contained in the data directory. Each subfolder in the directory is named by subject (N = 27 subjects, subject 0 through subject 26). In each subject folder, there are various files containing information related to the raw head movement data for that subject. The important files are:
- imageList.txt
- This file contains the order in which images were presented to the subject. Images from each category were presented in a pseudo-random order. Five repeat images were presented at the end of the experiment.
- tutorial.csv
- This file contains the raw head movement traces during the initial calibration tutorial, where subjects had to orient their heads to nine different targets within a fixed grid. The columns are "Time" (timestamp in milliseconds), "X" (X-position of the head mapped onto a 640x480 image), "Y" (Y-position of the head mapped onto a 640x480 image), and "Event" (a "1" indicates whenever the subject succesfully moved their head to one of the targets).
- image(image_id)data.csv
- These files contain the raw head movement traces during each image presentation. image_id corresponds to the image number of the presented scene (see Natural Image Dataset section above). If the image was a repeat image, then "repeated" is appended to the filename, i.e. image(image_id)data_repeated.csv. The columns are "Time" (timestamp in milliseconds), "Intersection (X)" (X-position of the head mapped onto a 640x480 image), "Intersection (Y)" (Y-position of the head mapped onto a 640x480 image). We do not use the last two columns, "Angle (X and Y)," which are the visual angles corresponding to the recorded head positions.
- *.WMA
- These files correspond to audio recordings made during the experiments. Subjects were asked to verbally describe in one sentence what they remembered about a scene after each image presentation. As a fair warning, these files are not well-annotated, so it may be difficult to extract meaningful information from them.
We also include our post-processing code (post_process.m and analyze_csv.m), which was used to generate the data and figures used in our paper. These post-processing routines create a structure named "results", which is saved as results.mat. The "results" structure contains the head movement data organized by subject, image category, and image presentation number. For example, to get head movement data for the sixth subject viewing the second image category ("fractals") on the fifth image presentation, use the following command: results(6).cat(2).image(5). This will return several important metrics:
- pos_interp (interpolated X/Y head movement trace)
- fix_location (location of head "fixations" in X/Y pixel coordinates)
- mvt_duration (head movement duration)
- mvt_amplitude (head movement amplitude)
- mvt_peakvel (head movement peak velocity)
- mvt_angle (head movement angle)
- ang_vel_mag (head velocity magnitude)
- ang_vel_dir (head velocity angle)
Please refer to the paper and analyze_csv.m for more details on these metrics and how they were calculated.
We also compared head movements with other measures of visual attention, including eye movements and interest point selections. We used the map comparison technique of Jeck et al, 2017 (see reference below):
@article{Jeck_etal17,
    Title={Attentive pointing in natural scenes correlates with other measures of attention},
    Author={Jeck, Daniel M and Qin, Michael and Egeth, Howard and Niebur, Ernst},
    Journal={Vision Research},
    Volume={135},
    Pages={54--64},
    Year={2017},
    Publisher={Elsevier}
}
Code for the map comparison technique can be found in the map-compare submodule. Other analysis code can be found in the saliency directory. Since the smoothed maps were too large to include with this repository, they have to be generated from the raw data using gen_maps.m. For example, to create the smoothed head movement maps, run the following:
 load('head_pts.mat');
 gen_maps(head_points);
The same can be done for the fixation and interest point data. Be sure to change the name of the saved map accordingly at the bottom of the gen_maps.m function.
The resources directory contains the Hu_etal '17 CISS paper and conference presentation slides. If you have any questions about the code or the data, please feel free to contact me at bhu6 (AT) jhmi (DOT) edu.
