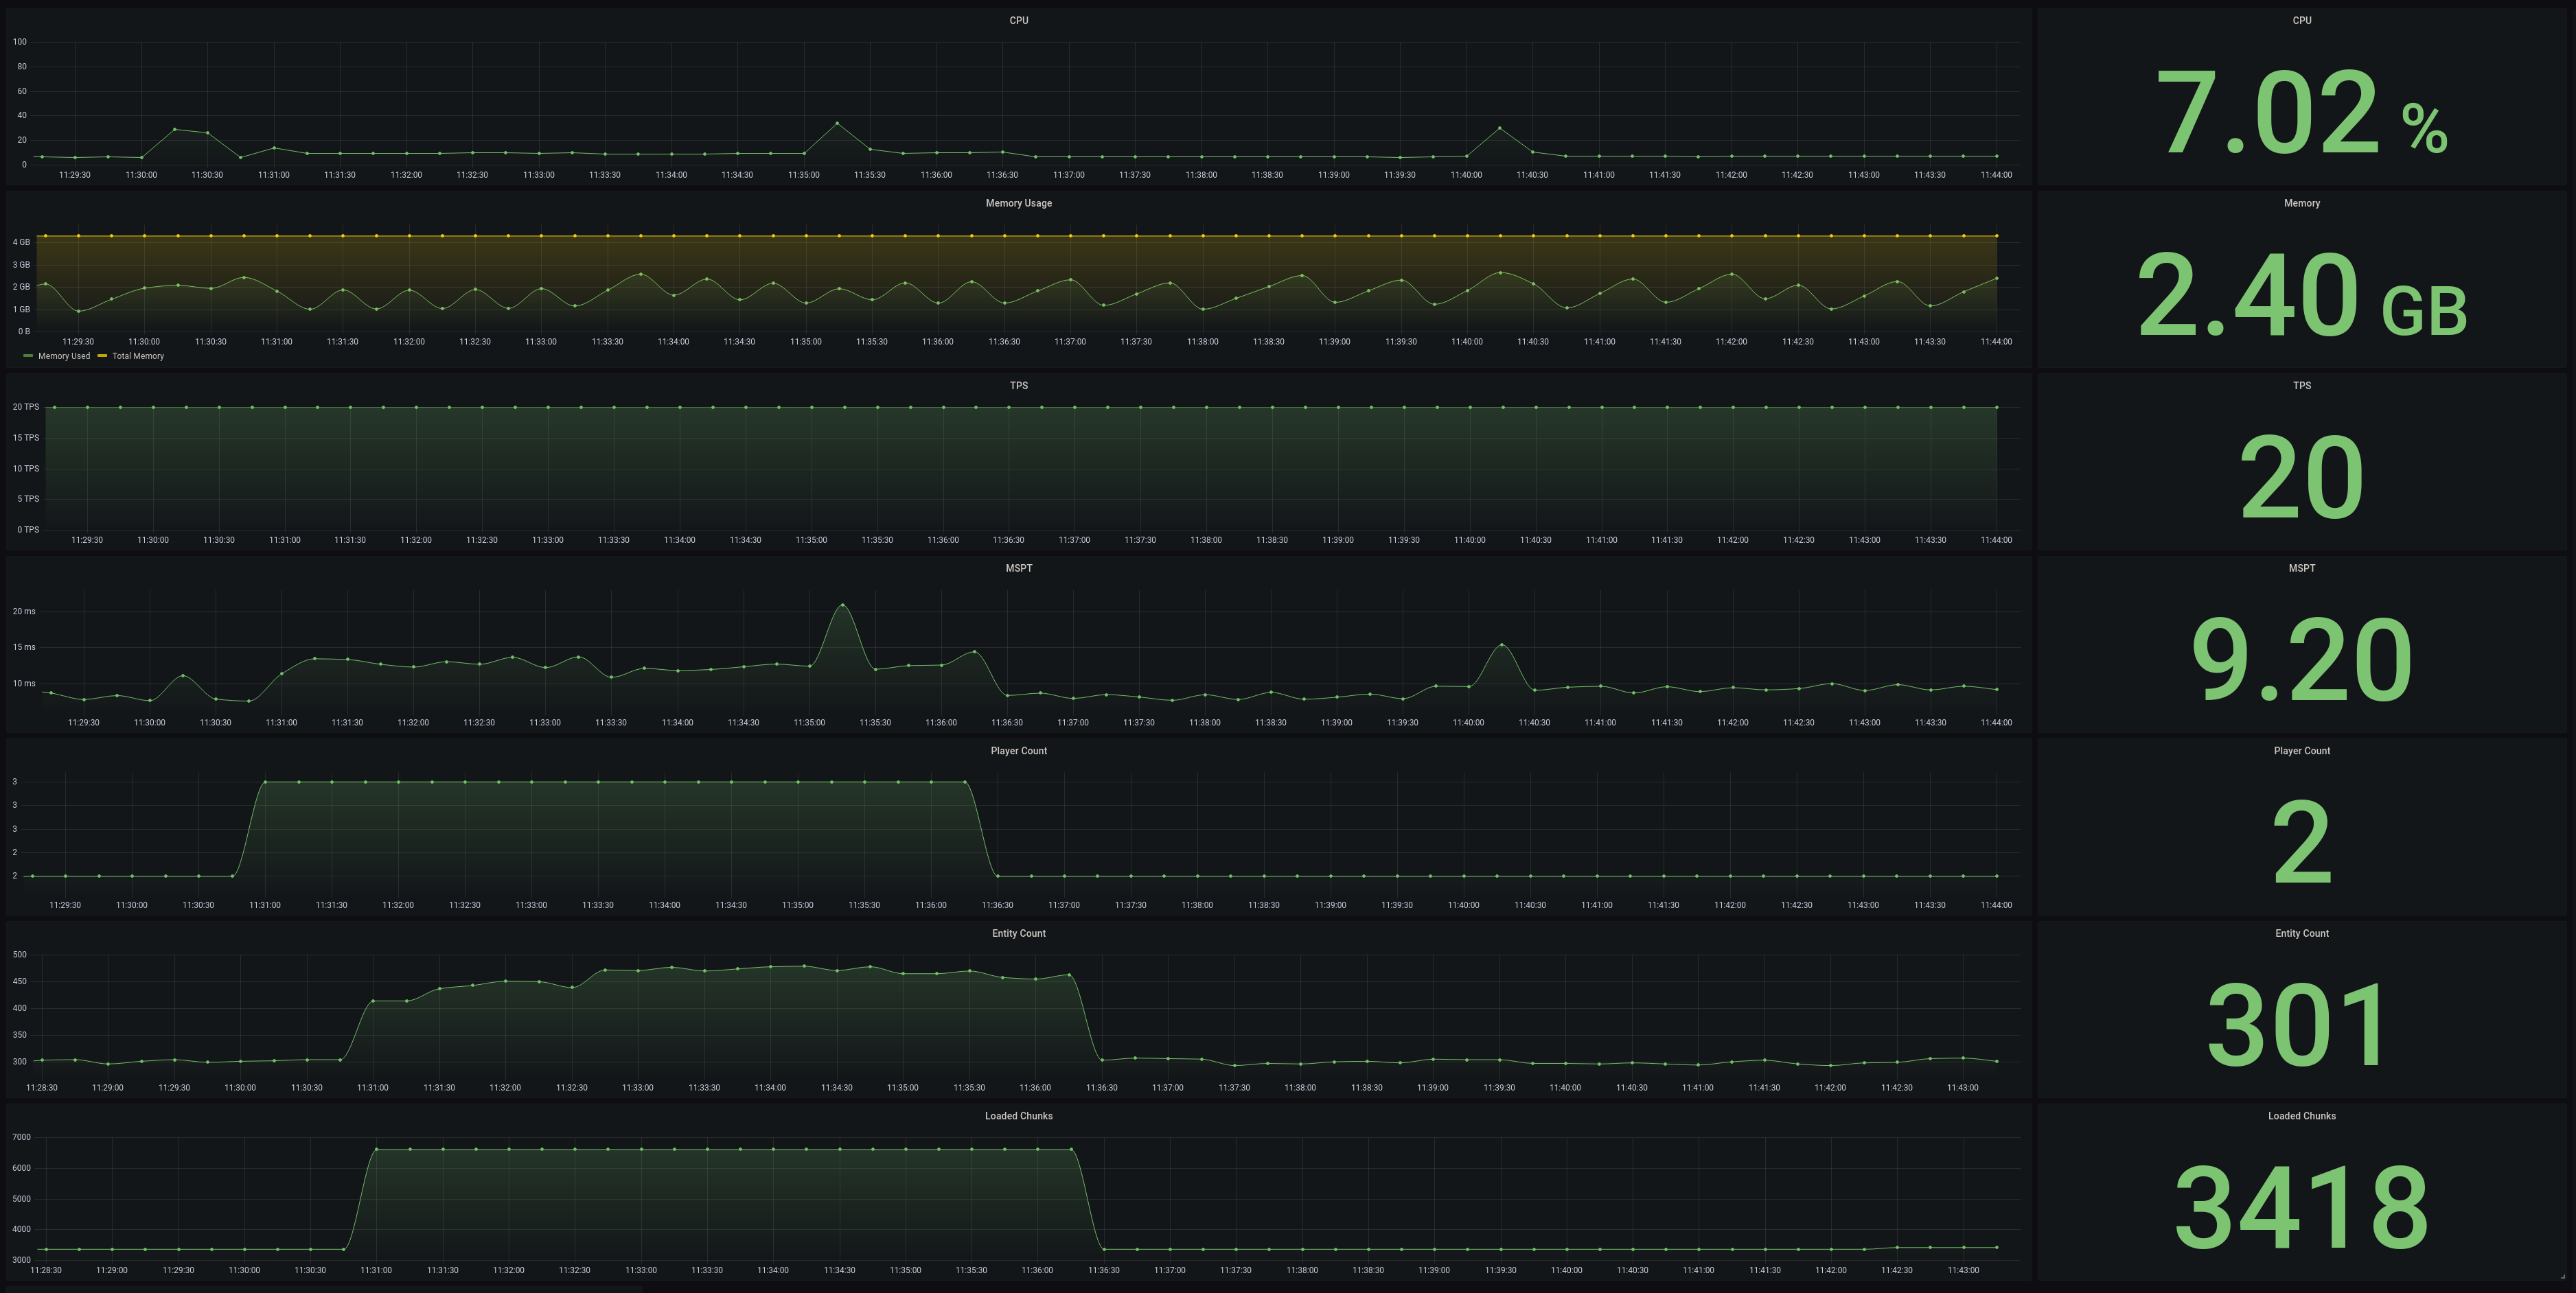
Visualize your Minecraft server statistics in realtime for Minecraft 1.8+ (Only 1.17+ for Fabric)
Want to learn more? Visit serverstats.diced.me for the latest downloads and documentation.
There's multiple places where you can download ServerStats
buildsbranch contains builds from every stable tag release- Website contains the builds from stable releases
- GitHub Releases contains the builds from stable releases
(dl.diced.me/serverstats/latest)
dev-buildsbranch contains builds from every commit- GitHub Actions Artifacts zip file containing jars from commit actions
- Easy: setup ServerStats in minutes
- Prometheus: export stats to prometheus
- Grafana: visualize your stats in Grafana using our provided dashboard
- Cross server compatible: works with proxy servers, Fabric and Bukkit compatible servers (Spigot, Paper, etc)
This is a list of all the metrics provides. The code block has the config property. Docs Link to Configuration
The online player count
Free memory in JVM
Max memory in JVM
Total memory allocated to JVM
Ticks per-second (usually 20)
Milliseconds per-tick (usually below 50ms for good perf)
CPU Percentage
Loaded chunks in each world
Entity count in each world
Disk space that each world is using
Packets that are being sent to clients and being read from clients
The time it took to do the last GC
The amount of JVM threads
The uptime of the server
You must be using Java 16+ as Fabric/Minecraft 1.17 requires it, or go into the directory you want and build using a different JDK.
git clone https://github.com/diced/ServerStats
cd ServerStats
./build.sh # custom build shell script that builds all modules and gives all jars in builds/ServerStats utilizes mono-repos/modules to have different server types in one repo.
- Common - Common modules with interfaces and abstract classes that bukkit/bungee/fabric/velocity use
- Bukkit/Bungee/Fabric/Velocity - Uses the common module's interfaces to implement a platform specific plugin
