SoyutNet is a place/transition net (PT net, Petri net) simulator that uses Python's asyncio task and synchronization utilities as backend. (Soyut means abstract in Turkish.)
Its documentation can be found at https://soyutnet.readthedocs.io
python3 -m venv venv
source venv/bin/activate
pip install -e '.[dev]'
pytestpython3 -m venv venv
source venv/bin/activate
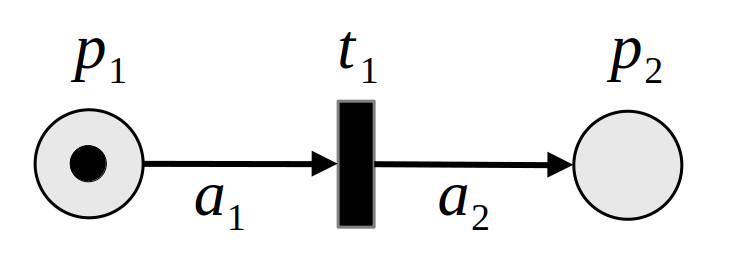
pip install soyutnetThis example simulates the PT net given in the diagram below.
import sys
import asyncio

import soyutnet
from soyutnet import SoyutNet
from soyutnet.constants import GENERIC_ID, GENERIC_LABEL


def main():
    async def scheduled():
        await asyncio.sleep(1)
        soyutnet.terminate()

    net = SoyutNet()
    net.DEBUG_ENABLED = True

    LABEL = 1
    initial_tokens = {
        GENERIC_LABEL: [GENERIC_ID],
        LABEL: [1000, 990],
    }
    reg = net.PTRegistry()
    o1 = net.Observer(verbose=True)
    p1 = net.Place("p1", initial_tokens=initial_tokens, observer=o1)
    o2 = net.Observer(verbose=True)
    p2 = net.Place("p2", observer=o2)
    t1 = net.Transition("t1")
    """Define places and transitions (PTs)"""

    p1.connect(t1, labels=[GENERIC_LABEL, LABEL]).connect(
        p2, labels=[GENERIC_LABEL, LABEL]
    )
    """Connect PTs"""

    reg.register(p1)
    reg.register(p2)
    reg.register(t1)
    """Save to a list of PTs"""

    soyutnet.run(reg, extra_routines=[scheduled()])
    print("Simulation is terminated.")

    records = reg.get_merged_records()
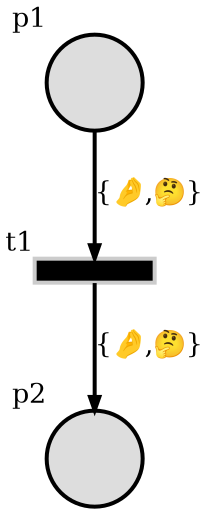
    graph = reg.generate_graph(indent="  ", label_names={ LABEL: "🤔", GENERIC_LABEL: "🤌" })

    print("\nRecorded events:")
    {None: net.print(rec) for rec in records}
    print("\nNet graph:")
    print(graph, file=sys.stderr)

    return records, graph


if __name__ == "__main__":
    main()
outputs:
$ python tests/readme_example.py

loop(t1, 3): REC: O{(p1, 1)}: (193215.922177, ((0, 1, ), (1, 2, ), ), t1, )
loop(t1, 3): REC: O{(p1, 1)}: (193215.922371, ((0, 0, ), (1, 2, ), ), t1, )
loop(t1, 3): REC: O{(p1, 1)}: (193215.922544, ((0, 0, ), (1, 1, ), ), t1, )
Simulation is terminated.

Recorded events:
(p1, (193215.922177, ((0, 1, ), (1, 2, ), ), t1, ), )
(p1, (193215.922371, ((0, 0, ), (1, 2, ), ), t1, ), )
(p1, (193215.922544, ((0, 0, ), (1, 1, ), ), t1, ), )

Net graph:
digraph Net {
  subgraph cluster_0 {
    p1_0 [shape="circle",fontsize="20",style="filled",color="#000000",fillcolor="#dddddd",label="",xlabel="p1",height="1",width="1",penwidth=3];
    p2_0 [shape="circle",fontsize="20",style="filled",color="#000000",fillcolor="#dddddd",label="",xlabel="p2",height="1",width="1",penwidth=3];
    t1_0 [shape="box",fontsize="20",style="filled",color="#cccccc",fillcolor="#000000",label="",xlabel="t1",height="0.25",width="1.25",penwidth=3];
    t1_0 -> p2_0 [fontsize="20",label="{🤌,🤔}",minlen="2",penwidth="3"];
    p1_0 -> t1_0 [fontsize="20",label="{🤌,🤔}",minlen="2",penwidth="3"];
  }
  clusterrank=none;
}
How to interpret events
('p1', (188597.931257369, ((0, 1), (1, 2)), 't1'))

A list of place markings that show token counts for each label recorded just before a transition is fired:
[('<name of the place>', (<event timestamp in seconds>, ((<token label>, <token count>),), '<firing transition>')), ...]
How to generate the graph
sudo apt install graphviz # Which provides 'dot'
python tests/readme_example.py 2>&1 > /dev/null | dot -Tpng > readme_example.png
Outputs:


