This repository illustrates how to automate a data science or statistics task via GitHub Actions.
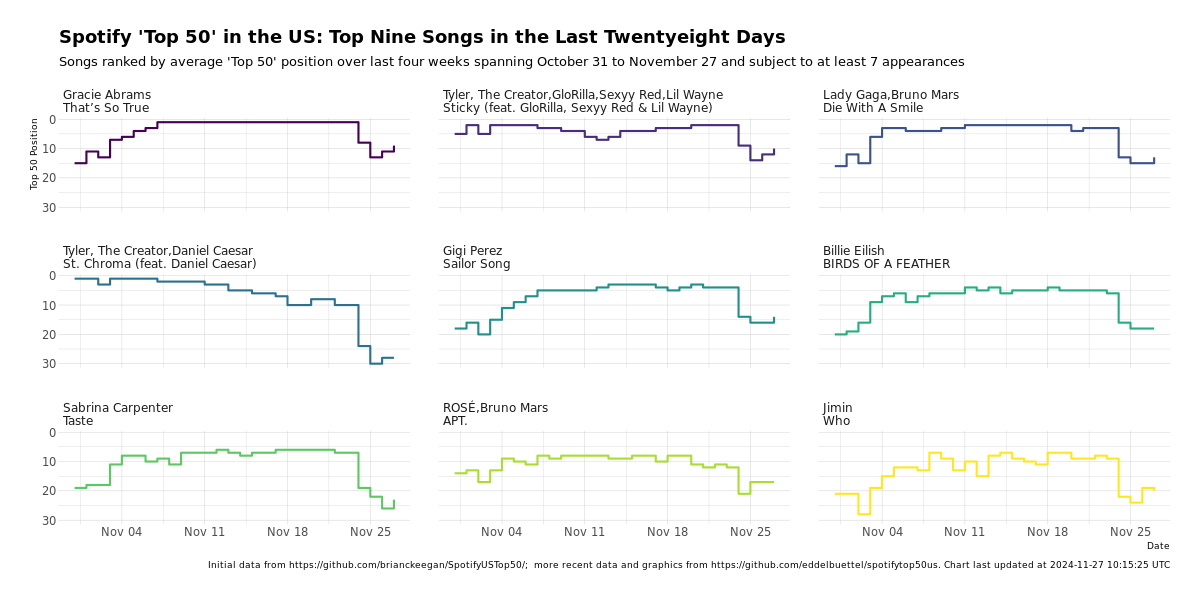
We also provide a 'movie' collating the one hundred most recent images as an aninmated gif:
A toot by Brian Keegan described the basic idea, his repo contains a basic implementation (in Python, but without chart generation when I checked). As this provides a nice example for use in, for example, my STAT 447 class I decided to build on it.
Thanks to
- Brian Keegan for the initial toot,
- Troy Hernandez for tinyspotifyr (also a CRAN package)
- the authors of spotifyr from which it was derived),
- Bob Rudis for hrbrthemes from which I derived my tinythemes used here
- and also to Spotify for providing an API.
Getting started with a RESTful API such the Spotify Web API can be tricky. Please consult one the existing CRAN packages (i.e. tinyspotifyr or spotifyr) for details. You need to register an 'app' on their site in order to be authorized and get an access token. From R this works via a pair of environment variables along with a (one-time) browser-based callback to align with your normal login to bless these credentials.
This repository and its code have been put together by Dirk Eddelbuettel.
The code in this repository is licensed under the GNU GPL, Version 2 or later.