Important
t.viz() has been deprecated. Please use tensorhue.viz(t) instead.
Note
TensorHue is currently in alpha. We appreciate any feedback!
TensorHue is a Python library that allows you to visualize tensors right in your console, making understanding and debugging tensor contents easier.
You can use it with your favorite tensor processing libraries, such as PyTorch, JAX, and TensorFlow, and a large set of related libraries, including Numpy, Pillow, torchvision, and more.
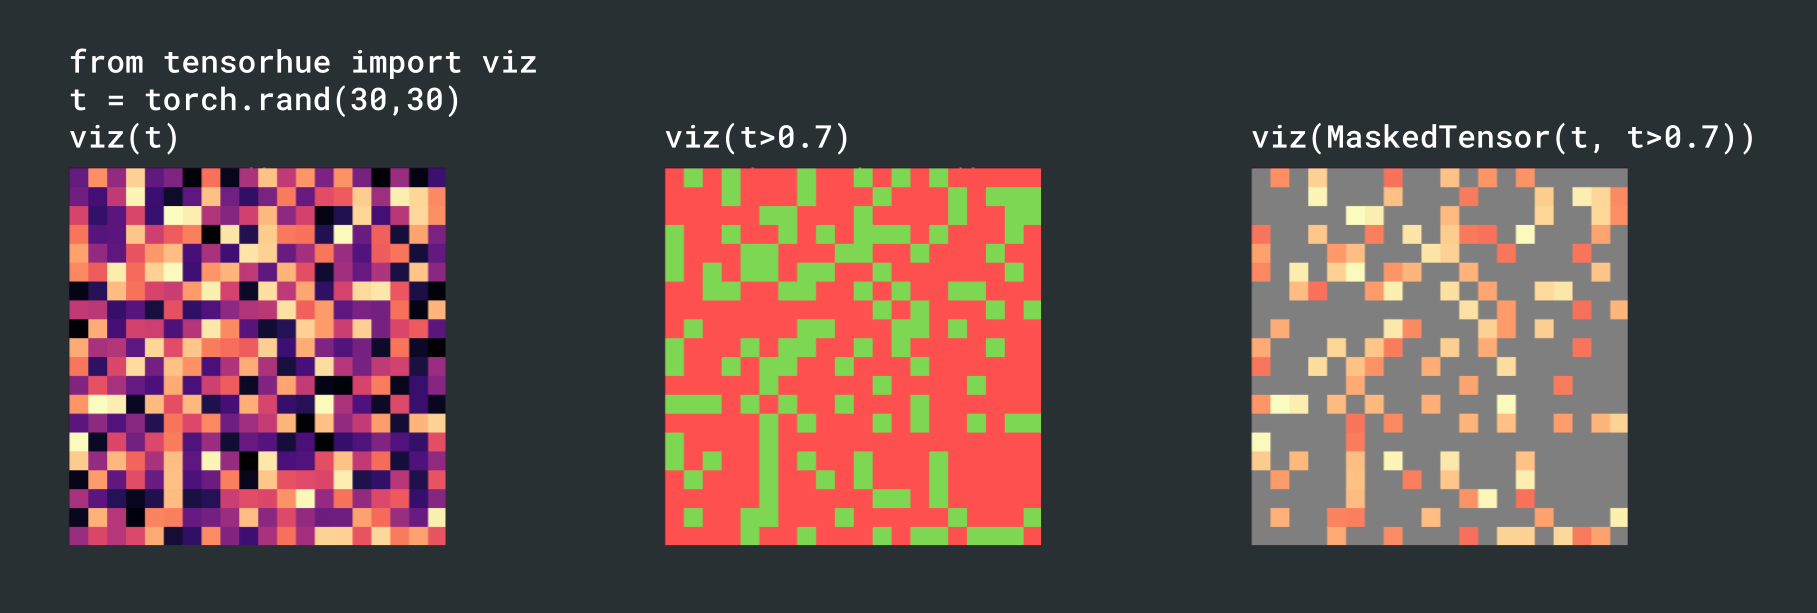
TensorHue automagically detects which kind of tensor you are visualizing and adjusts accordingly:
Install TensorHue with pip:
pip install tensorhueUsing TensorHue is easy, simply import TensorHue together with the library of your choice:
import torch
import tensorhue
Or, alternatively:
from tensorhue import vizThat's it! You can now visualize any tensor by calling .viz() on it in your Python console:
t = torch.rand(20,20)
tensorhue.viz(t) ✅Pillow images can be visualized in RGB and other color modes:
from torchvision.datasets import CIFAR10
dataset = CIFAR10('.', dowload=True)
img = dataset[0][0]
tensorhue.viz(img) ✅
By default, images get downscaled to the size of your terminal, but you can make them even smaller if you want:
tensorhue.viz(img, max_size=(40,40)) ✅You can pass along your own ColorScheme when visualizing a specific tensor:
from tensorhue import ColorScheme
from matplotlib import colormaps

cs = ColorScheme(colormap=colormaps['inferno'],
                 true_color=(255,255,255),
                 false_color=(0,0,0))
tensorhue.viz(t, colorscheme=cs) ✅
Alternatively, you can overwrite the default ColorScheme:
tensorhue.set_printoptions(colorscheme=cs)By default, TensorHue normalizes numerical values between 0 and 1 and then applies the matplotlib colormap. If you want to use diverging colormaps such as coolwarm or bwr and the value 0 to be mapped to the middle of the colormap, you need to specify the normailzer, e.g. matplotlib.colors.CenteredNorm:
from matplotlib.colors import CenteredNorm
cs = ColorScheme(colormap=colormaps['bwr'],
                 normalize=CenteredNorm(vcenter=0))
tensorhue.viz(t, colorscheme=cs) ✅
You can also specify the normalization range manually, for example when you want to visualize a confusion matrix where colors should be mapped to the range [0, 1], but the actual values of the tensor are in the range [0.12, 0.73]:
tensorhue.viz(conf_matrix, vmin=0, vmax=1, scale=3)
The scale parameter scales up the 'pixels' of the tensor so that small tensors are easier to view.


