Program to be used concurrently with Dennis Kodimer's CEC 222 lab. Features include:
- Drawing / Creating Waveforms
- Manipulating Waveforms
- Storing Multiple Waveforms
- Exporting Waveforms
These instructions will help get you a copy of the project up and running on your local machine.
This program runs on Python 3.x with the following required packages:
matplotlib
numpy
scipy
Note: The installation will automatically gather and install the required packages.
To download WAV2BIN, enter:
pip3 install wav2bin
To run, enter:
wav2bin
and let the magic do it's work.
Here are some helpful tips and pointers on how to use the software.
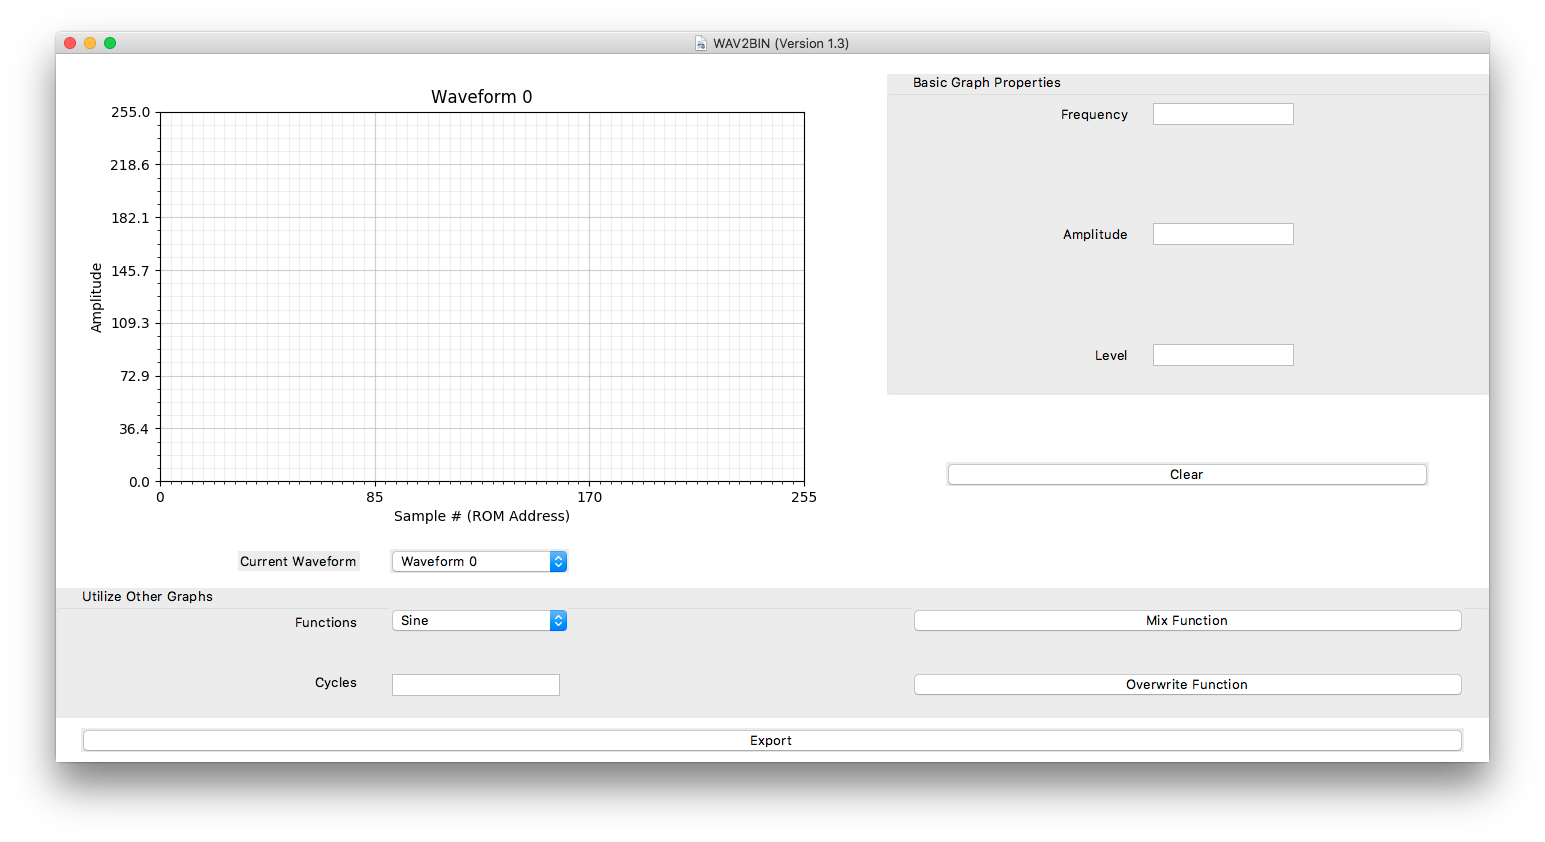
When the program is first run, a window should appear like this:
There are two ways to generate a waveform:
- Drawing
- Creating
Simply move the mouse from left-to-right on the plot to begin drawing a waveform.
Example:
When the right-edge is reached, a complete waveform should be visible.
Note: Drawing is disabled when a waveform has been drawn or created. To re-enable this, simply Clear the waveform.
Using the premade options at the bottom (located under Utilize Other Graphs) . . .
It is possible to create different pre-made waveforms. All that is required is:
- Enter value for
Cycles(Positive Float) - Select either
Mix FunctionorOverwrite Function
Mix Function is additive (will add waveform on top of currently made waveform).
Overwrite Function is replacement (will overwrite waveform in place of currently made waveform).
Example: Sine: 3 Cycles with Overwrite Function
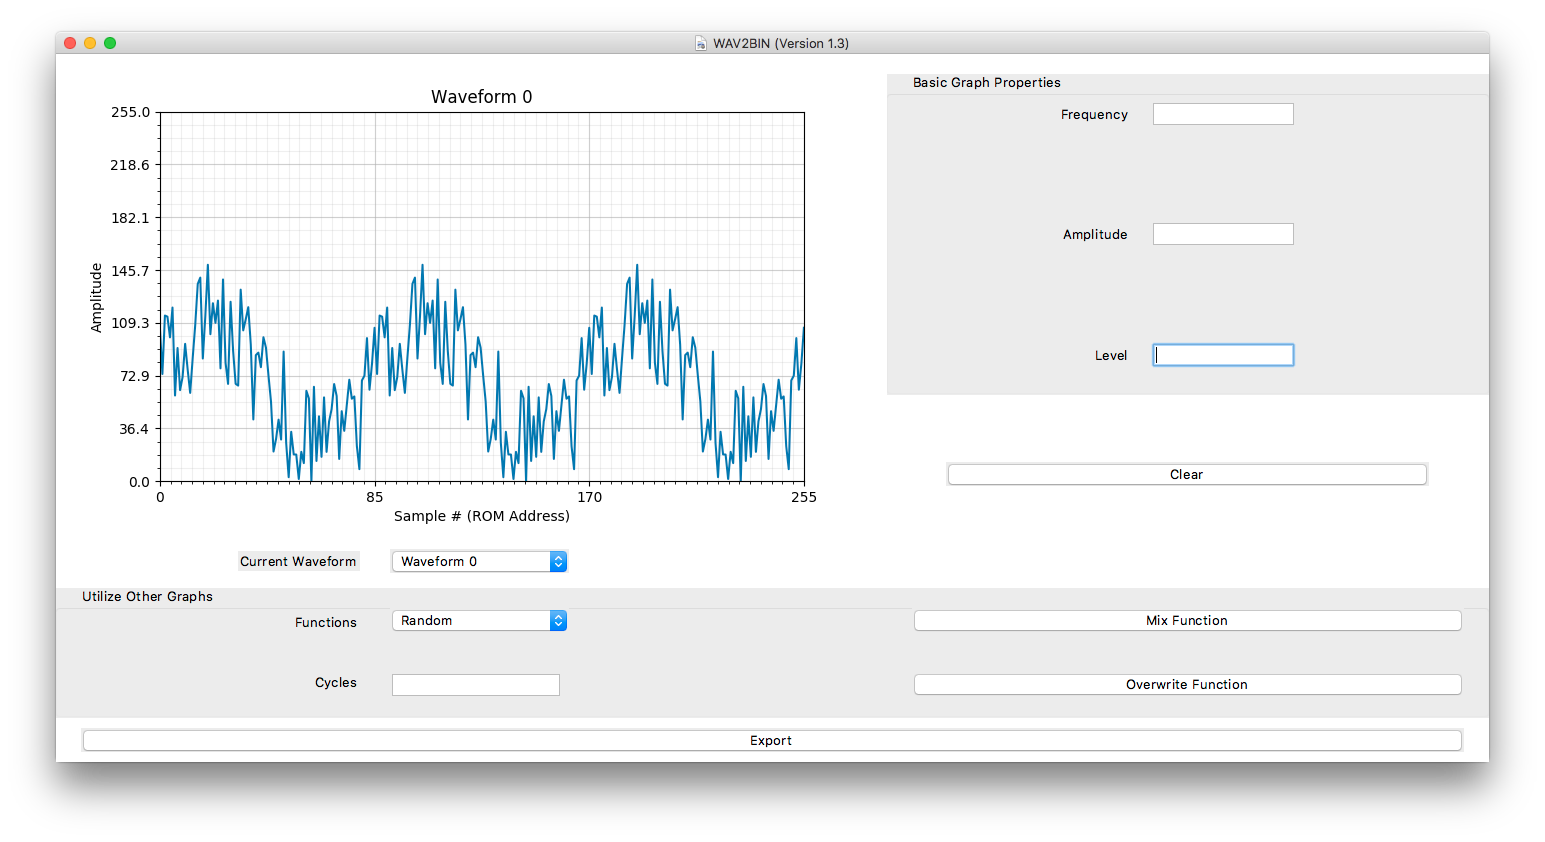
Example: Random: 2.5 Cycles with Mix Function
The basic properties of a waveform can be manipulated as well. These can be found under Basic Graph Properties:
- Frequency (Positive Integer)
- Amplitude (Float)
- Level (Float)
Simply enter a value and hit the return key.
Example: Level: -105
Example: Frequency: 3
In both cases, the Clear option should reset the waveforms to nothing.
Many waveforms can be stored and manipulated in this program (up to 32 total). Each is unique and separate from one another:
When Creating Waveforms, another waveform can be referenced for usage.
Example:
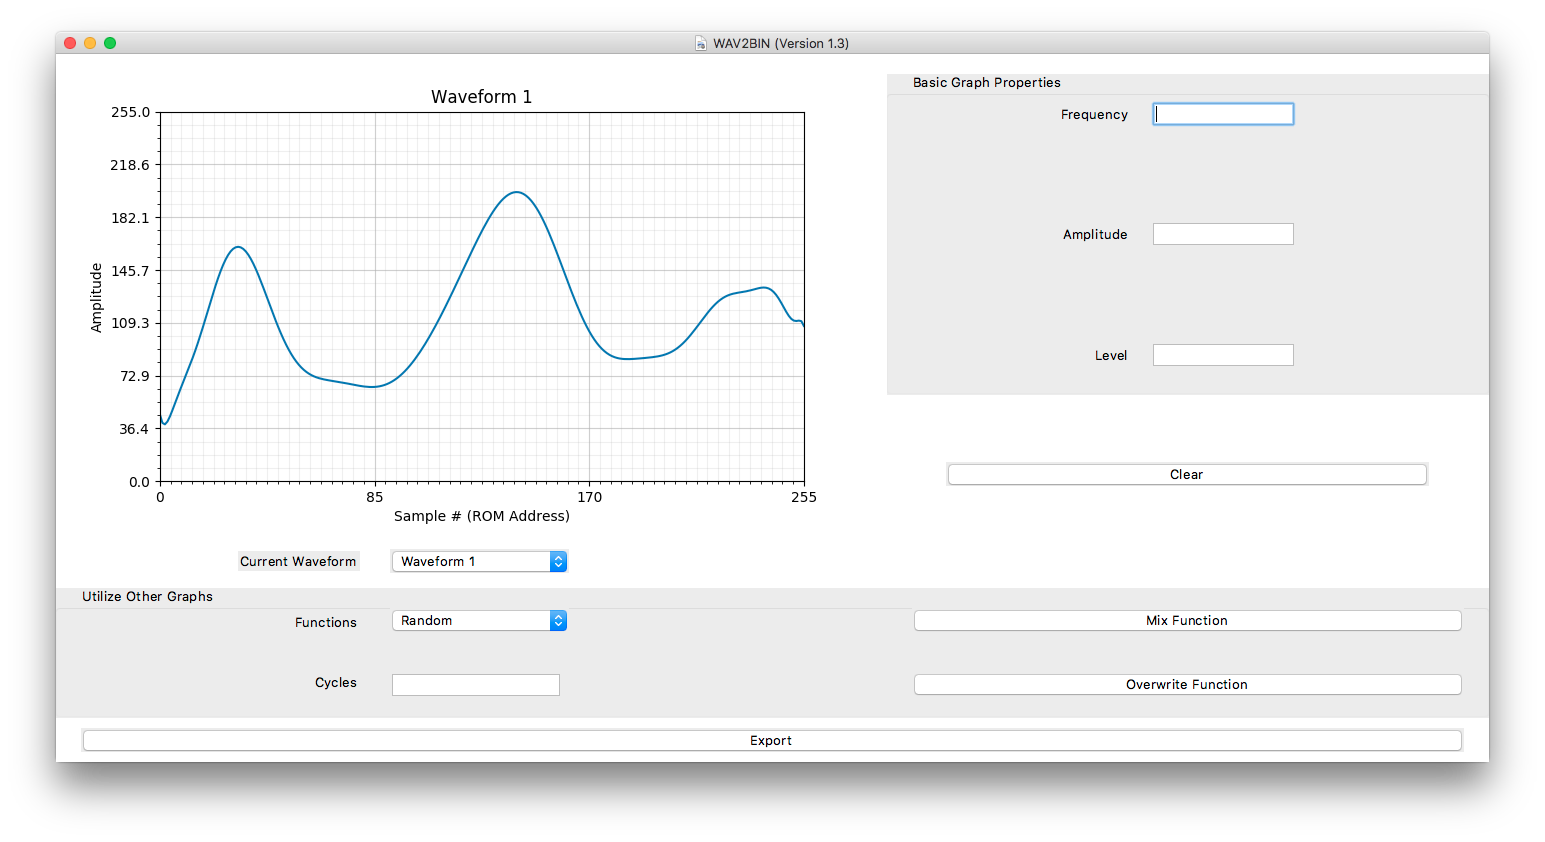
Let's say that this waveform is drawn under Waveform 1:
Going to Utilize Other Graphs → Functions, by selecting Waveform, another option box appears with values 0 - 31; these are the other waveforms that can be accessed.
Make sure that Waveform 0 is selected and enter 2 Cycles. Select Mix Function and the result should be as follows:
Once satisfied with the waveforms, they can all be exported to a .bin file. Simply select Export at the bottom. (There's an option to print to .pdf following selecting Export).
When exporting, there should be a screen of all the binary being sent to the file in hexadecimal form:
Followed by the produced .bin file.
If a .pdf was generated, it should look something like this:
- Joshua Van Deren - Initial work - jvanderen1
This project is licensed under the MIT License - see the LICENSE file for details


