-
Notifications
You must be signed in to change notification settings - Fork 1
Visualization
kosh edited this page Feb 28, 2022
·
3 revisions
Visualize time series data.
Create Recurrence Plot (RP) [] from time series data. This function displays the RP.
Find the distance between two points on the orbit and draw according to the
rule.
The drawing rule uses the simplest one (simple_threshold).
This can be changed. The rule just takes a matrix and returns the matrix. *params and **kargs are the arguments to the rule.
from hundun.exploration import show_recurrence_plot- u_seq
- rule=simple_threshold
- cmap=False,
- path_save_plot=None
- *params
- **kargs
- recurrence_plot:
numpy.ndarray
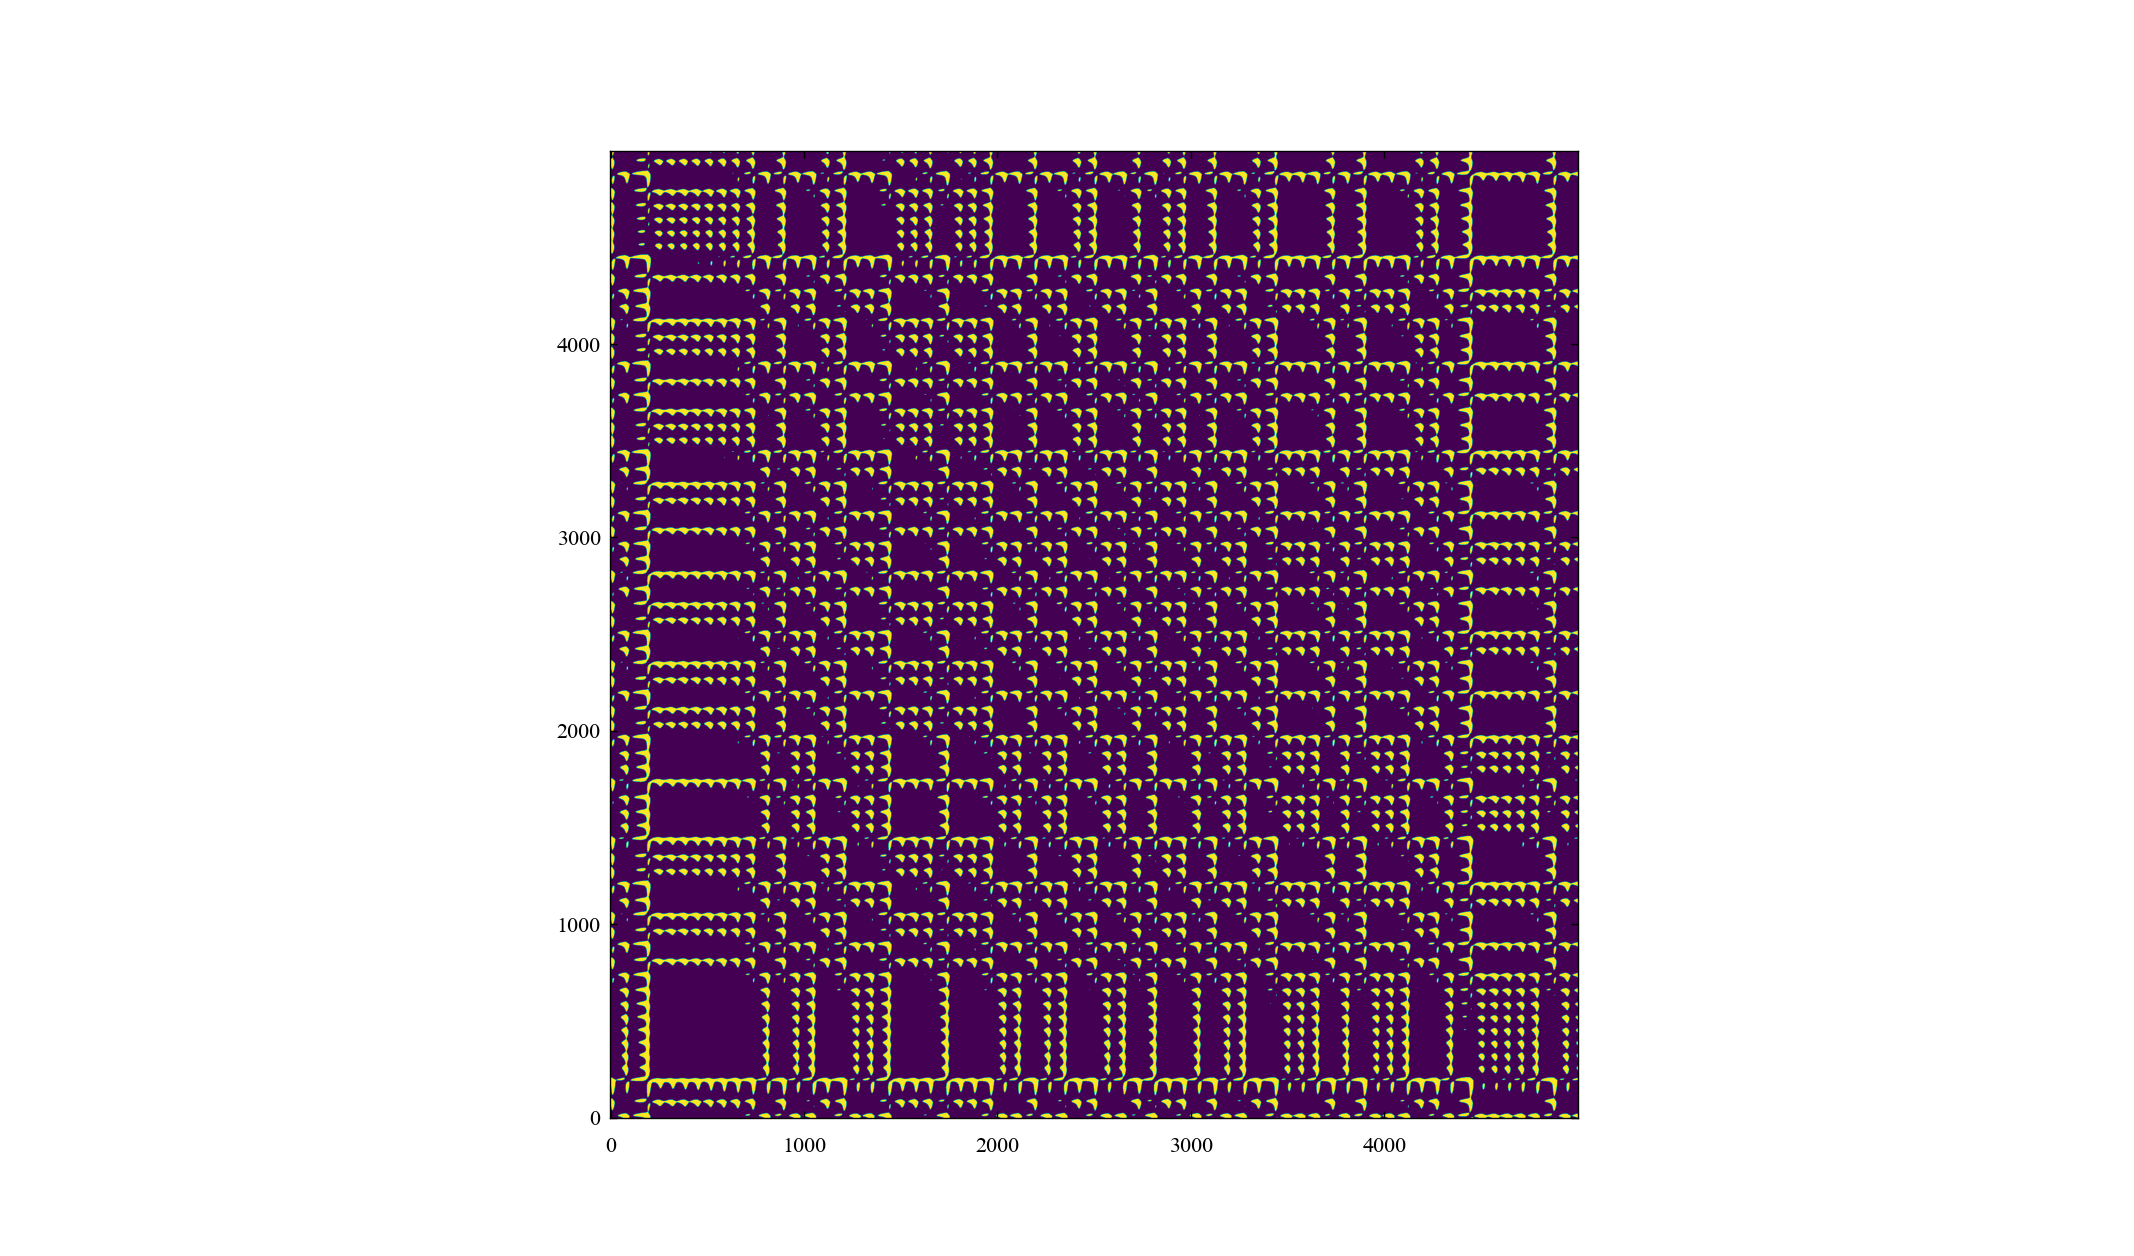
Here is the simplest example.
from hundun.equations import Lorenz
from hundun.exploration import show_recurrence_plot

u_seq = Lorenz.get_u_seq(5000)
show_recurrence_plot(u_seq)
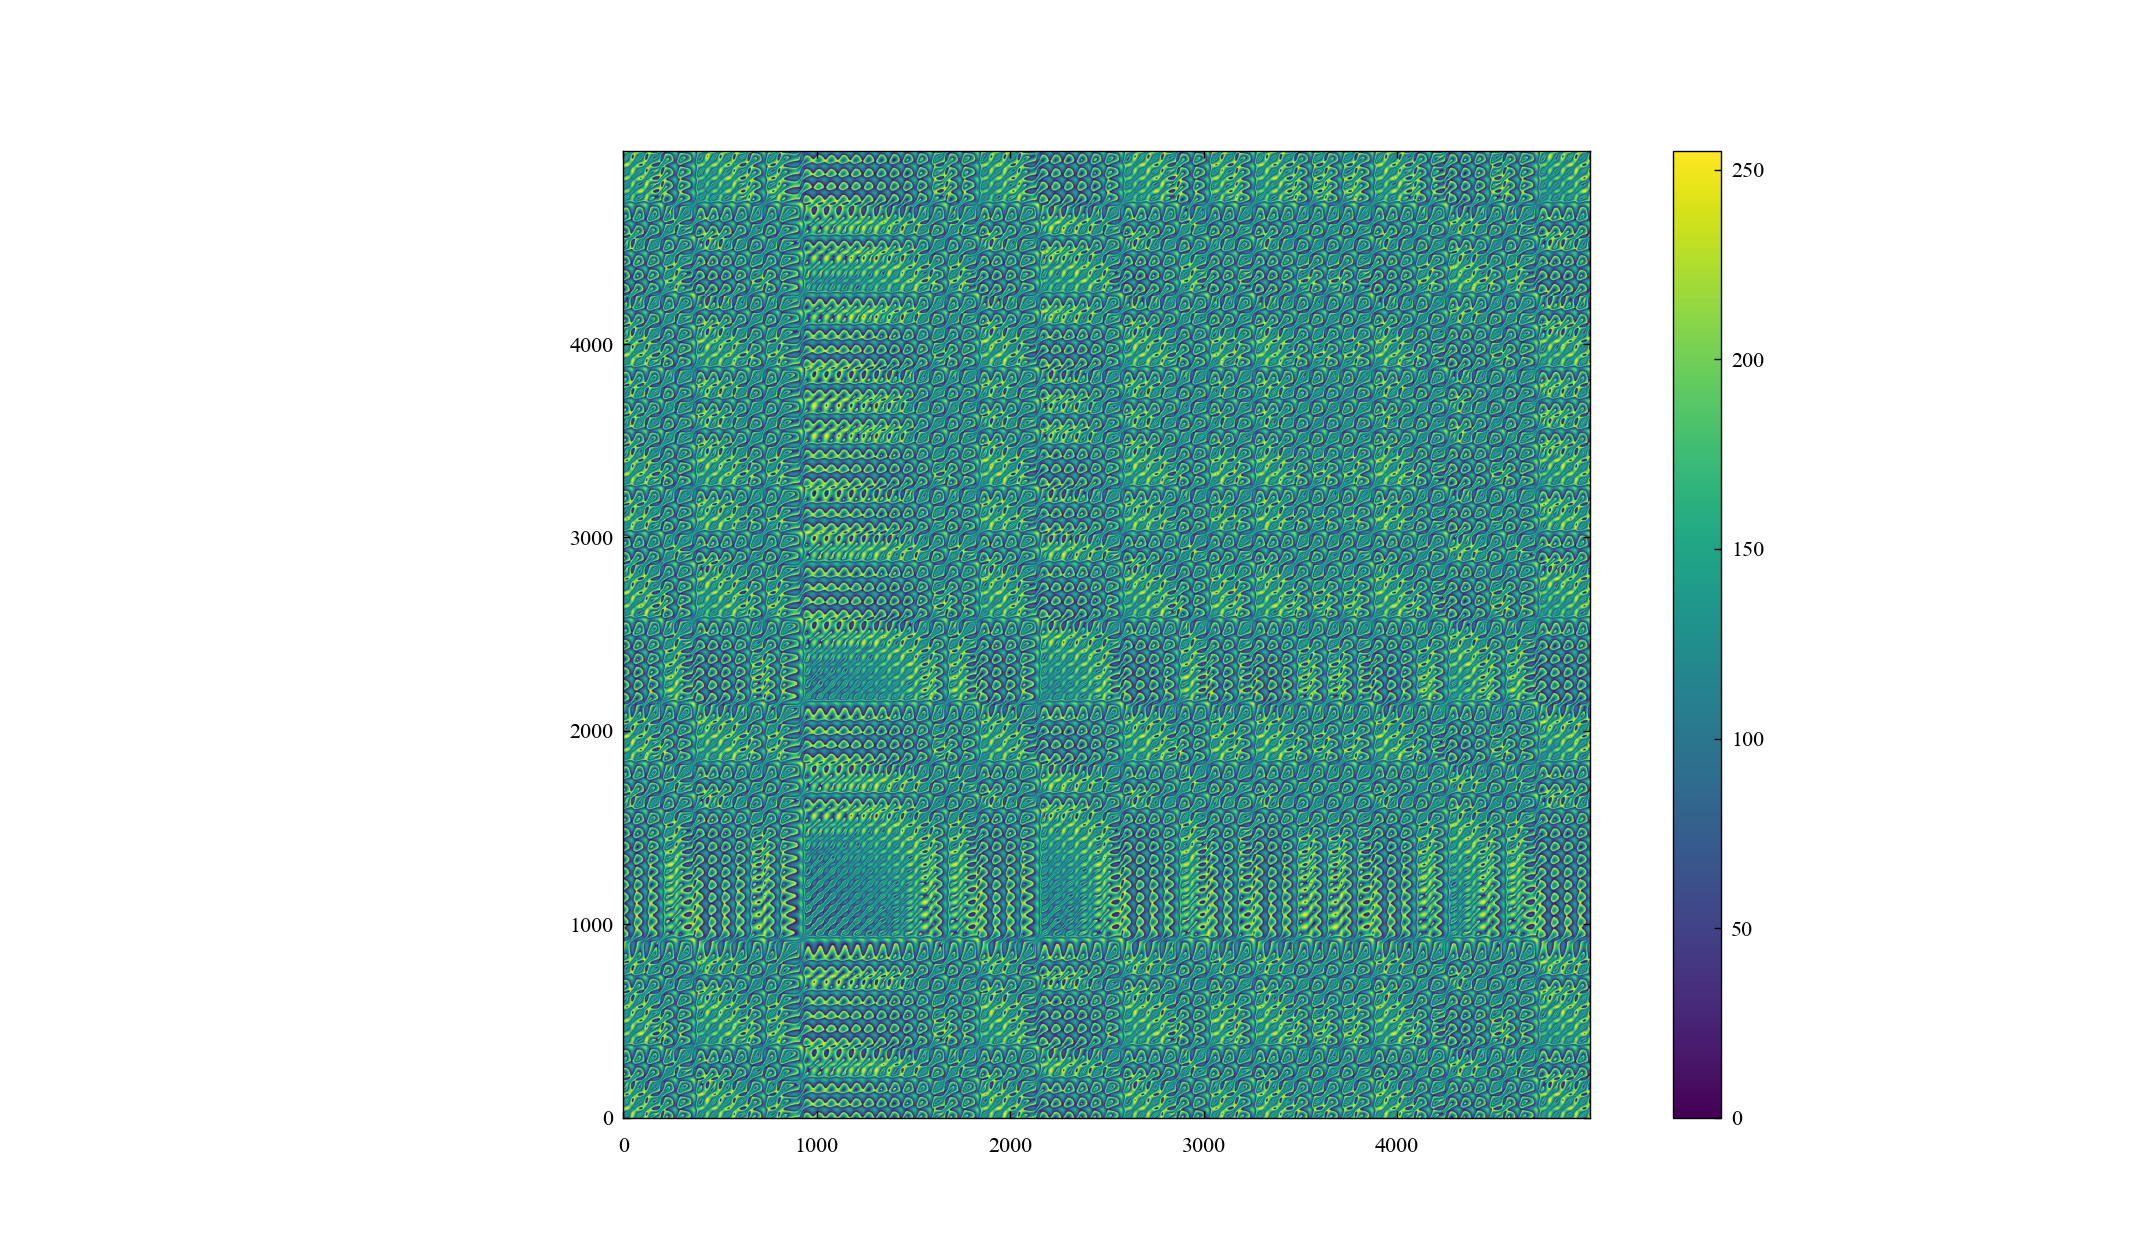
Shows the function and result when the Rule is changed.
from hundun.equations import Lorenz
from hundun.exploration import show_recurrence_plot
import numpy as np


def new_threshold(ds, func):
    if (d_max:=np.max(ds))!=0:
        pv = func(ds/d_max)*255
        return np.uint8(pv)
    return ds

u_seq = Lorenz.get_u_seq(5000)
show_recurrence_plot(u_seq, cmap=True, rule=new_threshold, func=np.log)
(1987) J.-P Eckmann and S. Oliffson Kamphorst and D Ruelle
DOI: 10.1209/0295-5075/4/9/004
Unlike show_recurrence_plot, it returns only RP.
from hundun.exploration import calc_recurrence_plot- u_seq
- rule=simple_threshold
- *params
- **kargs
- recurrence_plot:
numpy.ndarray
When the distance is above the threshold value
, it is 255, and when it is less than that, it is 0.
It is implemented as follows.
def simple_threshold(ds, theta=0.5):
    if (d_max:=_np.max(ds))!=0:
        pv = (ds/d_max>theta)*255
        return pv
    return ds
from hundun.exploration import simple_threshold