This repository contains a simple web page that demonstrates how to set up a dynamic dashboarding interface using Vega-Lite and the Open Justice Broker Consortium's Mondrian REST API. The demo uses the "Food Mart" sample dataset/schema that ships with the Mondrian library (and is available by default in the mondrian-rest API).
I recorded a screencast of the demonstration here:
The easiest way to run the demo locally is with docker:
docker run -d --name dashcard -p 58081:80 scottcame/dashcard
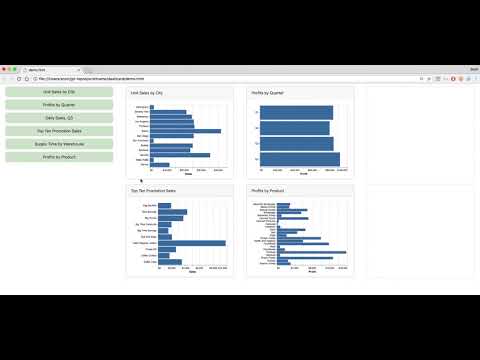
(Replacing the port with whatever port you wish.) Then the dashboard is available at: http://localhost:58081/dashcard/demo.html.
To run without Docker, just download the contents of this repo and open demo.html in your browser; this will run the demo in "demo mode" that does not require a connection to a mondrian-rest API instance (it
just hardcodes the query responses.) To connect to a mondrian-rest API instance, you'd need to grab the mondrian-rest web archive file and deploy it into a
Tomcat instance, then copy the contents of this repo into a directory under {tomcat-home}/webapps. Manually edit the js/viz-config.js file to set DEMO_MODE=false.
The file js/viz-config.js provides an example of how to configure the application. Currently it supports bar charts and timeline charts, with slightly different
configurations for each:
- panelTitle: Title for each card/widget in the resulting dashboard
- query: MDX query to execute
- vizType: bar
- measureName: Name of the measure in the resulting query json structure
- measureLabel: Label to use for the measure (x) axis in the resulting chart
- dimensionName: Name of the dimension in the resulting query json structure
- dimensionLabel: Label to use for the dimension (y) axis in the resulting chart
- measureFormat:
d3.jsformat to use for values on the measure (x) axis - transformFunction: a function that takes the json structure from mondrian-rest, and returns a similar structure; used to edit the values passed to Vega-Lite
- panelTitle: Title for each card/widget in the resulting dashboard
- query: MDX query to execute
- vizType: timeline
- measureName: Name of the measure in the resulting query json structure
- measureLabel: Label to use for the measure (x) axis in the resulting chart
- timeDimensionName: Name of the dimension representing time
- timeDimensionFormat:
d3.jsformat to use in formatting the timeline (x) axis - measureFormat:
d3.jsformat to use for values on the measure (x) axis - transformFunction: a function that takes the json structure from mondrian-rest, and returns a similar structure; used to edit the values passed to Vega-Lite