Creating data visualizations with D3 has long been on my bucket list. So, I started learning D3 and kept going for 30 days. Each day, I tried to build something from what I learned. Below is my progression in the form of completed projects.
Check out some projects at Codepen. Unfortunately, the non-Pro version of Codepen does not give you a way to load assets, like JSON files. Those projects are here though and have stubs in Codepen.
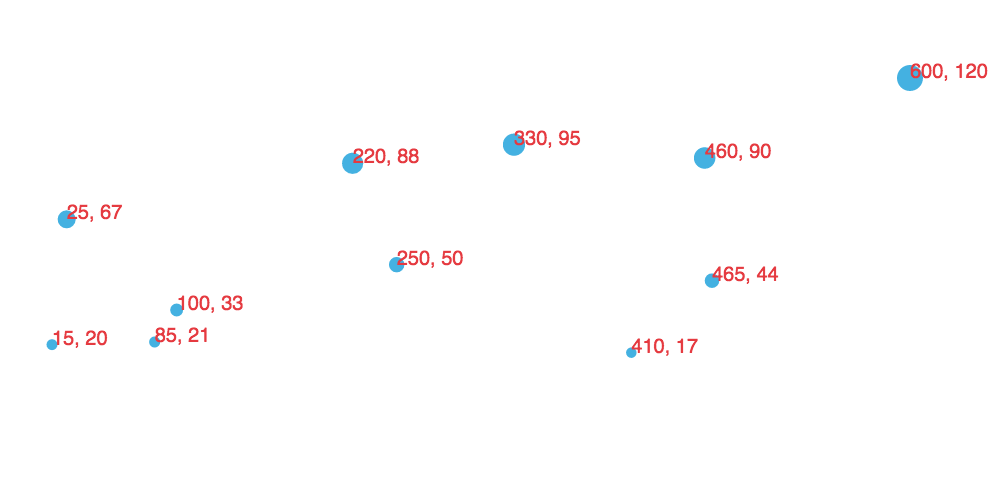
Project 4 - Simple Scatterplot
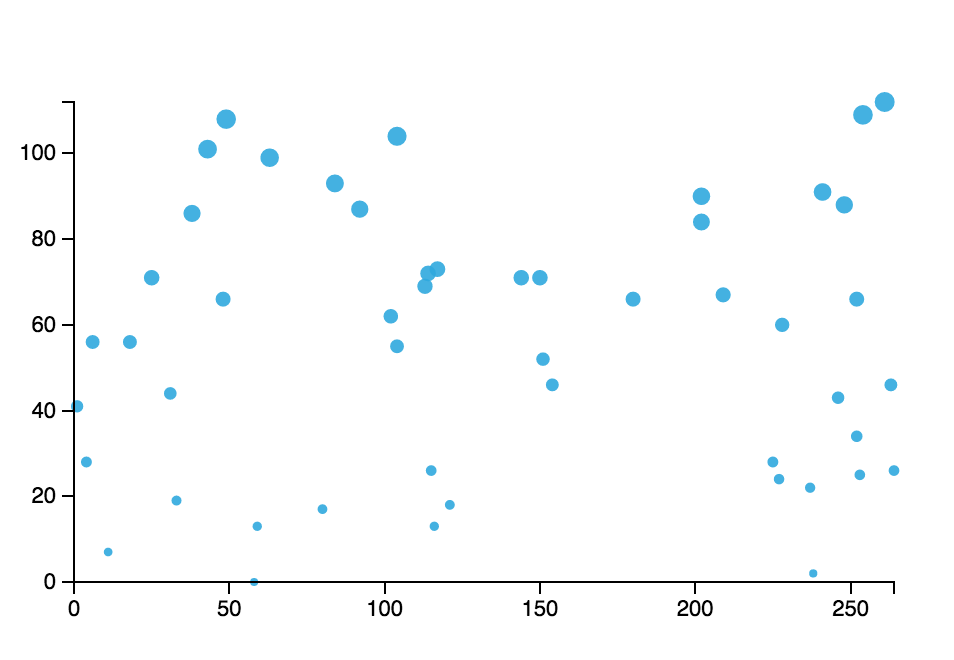
Project 5 - Scatterplot and Axes
Project 8 - US Population Bubble Map
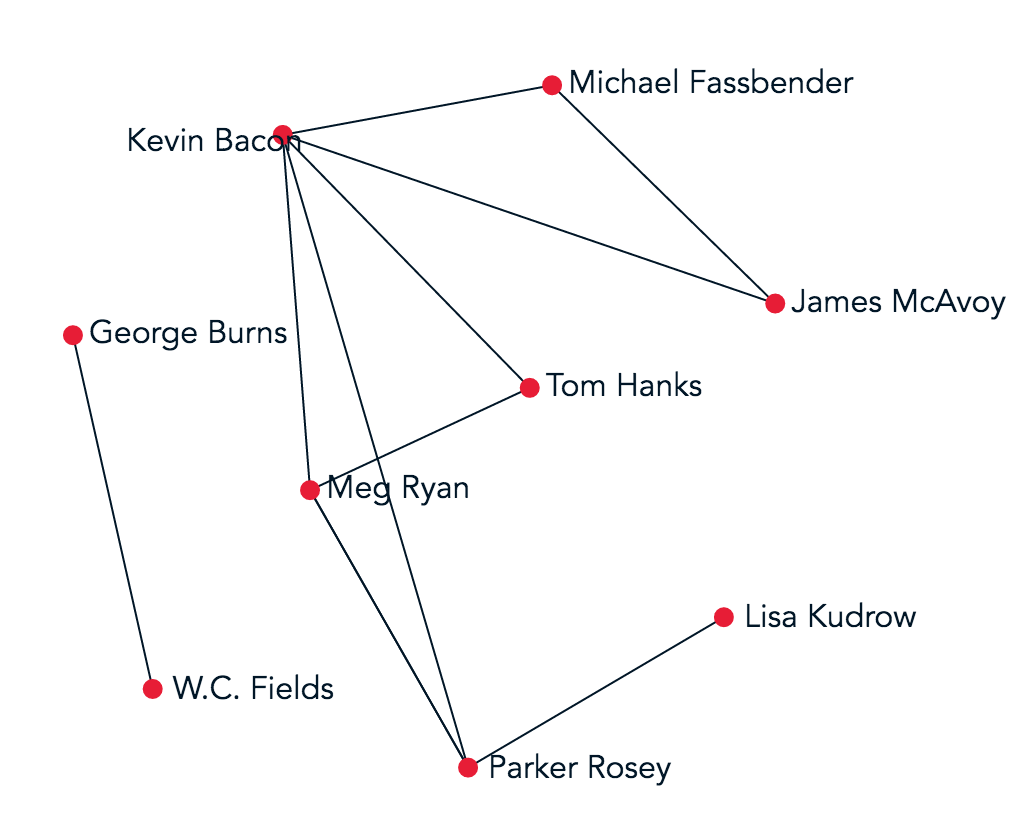
Project 9 - A Simple Kevin Bacon Graph
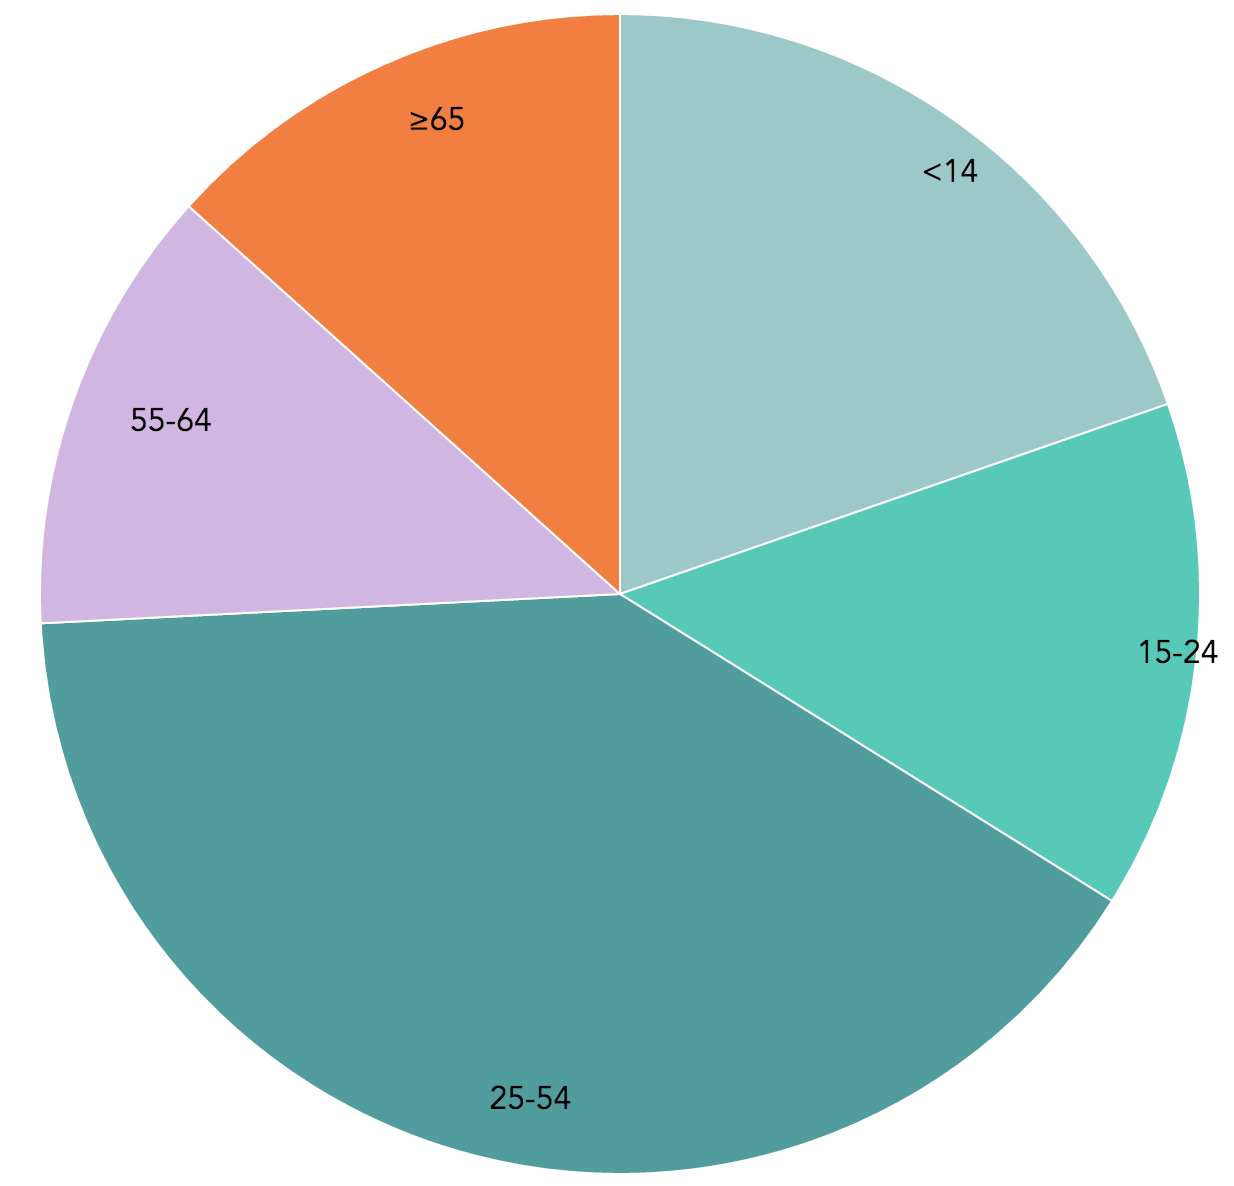
Project 11 - US Population Age Group Pie Chart
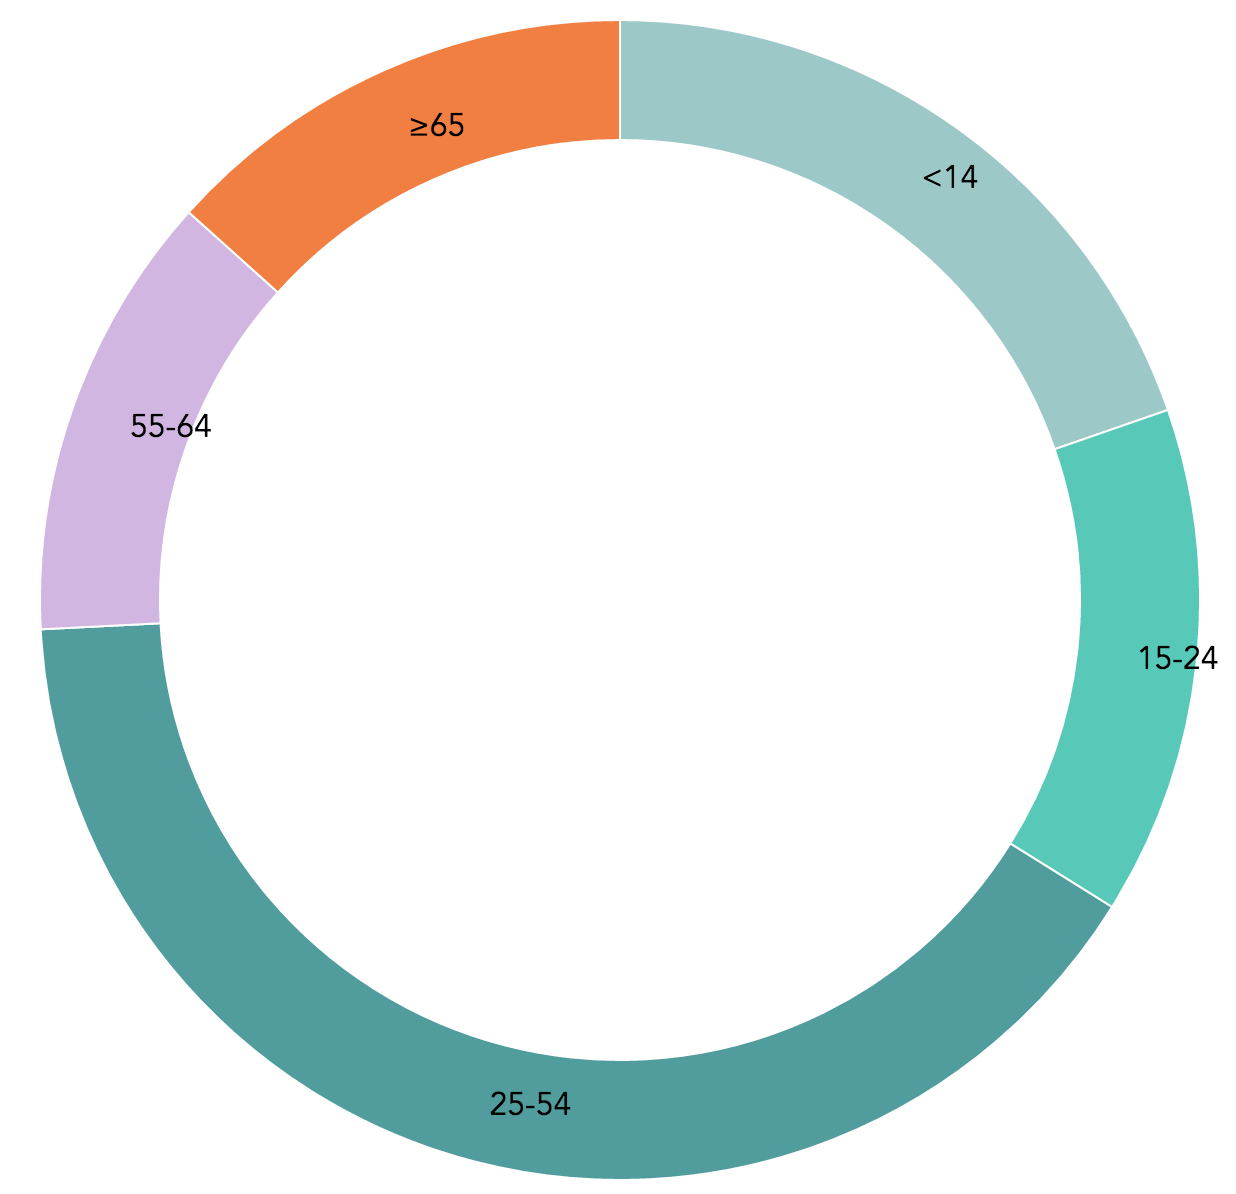
Project 12 - US Population Age Group Donut Chart
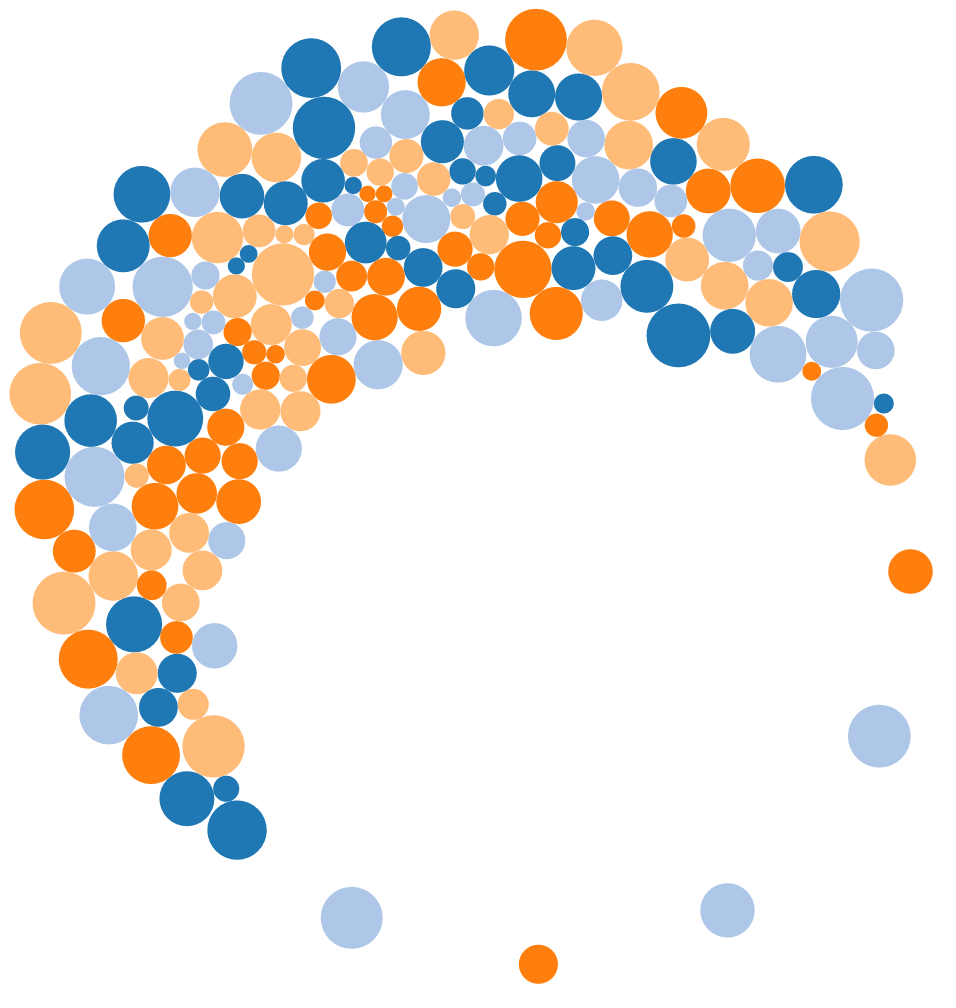
Project 13 - Force Layout Repulsion
Twitter: @ttruongchau
Check out thomastruongchau.com

