-
Notifications
You must be signed in to change notification settings - Fork 2k
New issue
Have a question about this project? Sign up for a free GitHub account to open an issue and contact its maintainers and the community.
By clicking “Sign up for GitHub”, you agree to our terms of service and privacy statement. We’ll occasionally send you account related emails.
Already on GitHub? Sign in to your account
Using margin to adjust legend.text?
#1502
Comments
|
Hmmm, this looks like an oversight - I seem to be doing something special for legends so they follow the usual process to get a |
|
Re-opening - because of the way the way themes, legends, and margins interact, this is going to require considerably more thought. |
|
Deleting the comments unrelated to the body of the problem. |
|
The basic problem is that I have no idea how the legend code works any more, and it's extremely complex due to the many possible places that theme settings can come from. |
|
I looked into this a bit at the end of the summer but never figured out the legend code enough to tackle it 😞 . I think the approach would need to be similar to what we did for strip labels, but I remember it being still more complicated for legends. |
|
I think I've got this working now (see: #2556), except for a minor problem with the default |
|
This old issue has been automatically locked. If you believe you have found a related problem, please file a new issue (with reprex) and link to this issue. https://reprex.tidyverse.org/ |


In issue #1435 on adjusting
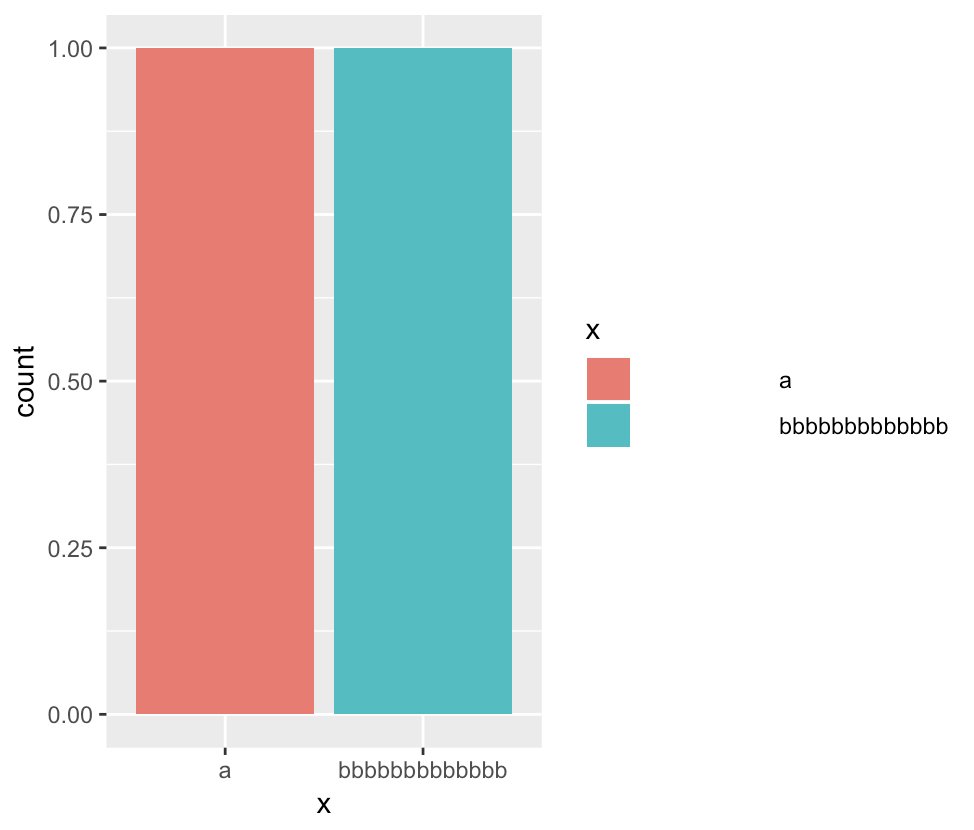
element_text, we find that "vjustandhjustno longer work. Instead, use themargin()parameter ofelement_text()". Does this apply also forlegend.text?I have a plot in which I want to adjust the
legend.texthorizontally.I followed the suggestion in #1435: "if you're having problems understanding the layout, try
debug = TRUE":I am not entirely sure I interpret the "debugging plot" correctly, but I thought it indicated all text elements which could be adjusted. Here, areas corresponding to
axis.text,axis.title, andplot.title, are highlighted, but seemingly not those forlegend.text(nor forlegend.title).I have tried to "push" and "pull" the
legend.texthorizontally using...with various combinations of
landr, to no avail.Thus my question: is
legend.text(andlegend.title) not included among theelement_textelements which can be adjusted usingmargin? Which is the current ''official' way to adjust these elements?The text was updated successfully, but these errors were encountered: