DX Analytics is a Python-based financial analytics library which allows the modeling of rather complex derivatives instruments and portfolios. Make sure to fully understand what you are using this Python package for and how to apply it. Please also read the license text and disclaimer.
DX Analytics is a Python-based financial analytics library that mainly implements what is sometimes called the global valuation of (complex portfolios of) derivatives instruments (cf. http://www.riskcare.com/files/7314/0360/6145/LowResRiskcare_Risk_0510_2.pdf). The major characteristic of this approach is the non-redundant modeling of all components needed for the valuation (e.g. risk factors) and the consistent simulation and valuation of all relevant portfolio components (e.g. correlated risk factors, multi-risk derivatives and portfolios themselves).
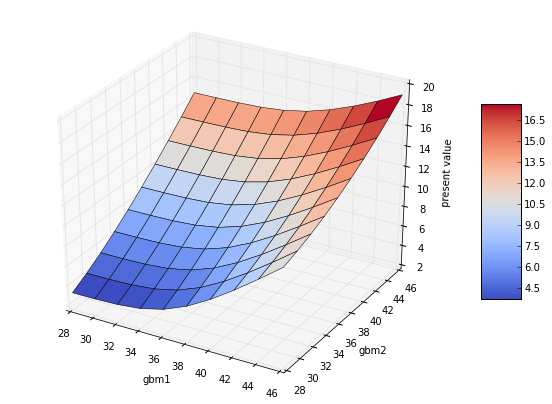
With DX Analytics you can, for instance, model and risk manage multi-risk derivatives instruments (e.g. American maximum call option) and generate 3-dimensional present value surfaces like this one:
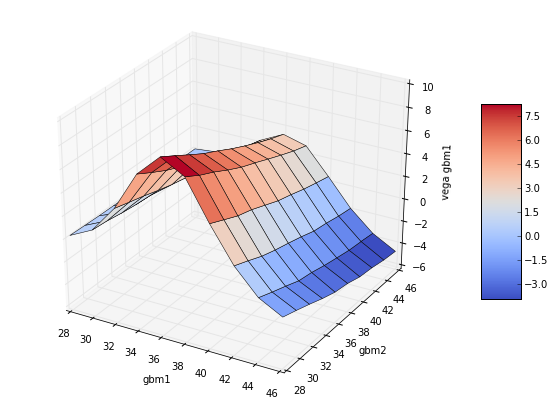
You can also generate vega surfaces for single risk factors like this one:
In addition, DX Analytics provides a number of other classes and functions useful for financial analytics, like a class for mean-variance portfolio analysis or a class to model interest-rate swaps. However, the focus lies on the modeling and valuation of complex derivatives instruments and portfolios composed thereof by Monte Carlo simulation.
In a sense, DX Analytics brings back office risk management modeling and valuation practice (e.g. used for Value-at-Risk or XVA calculations based on large scale Monte Carlo simulation efforts) to front office derivatives analytics.
This documentation cannot explain all technical details, it rather explains the API of the library and the single classes. There are two books available by the author of this library which are perfect companions for those who seriously consider to use the DX Analytics library. Both books together cover all major aspects important for an understanding and application of DX Analytics:
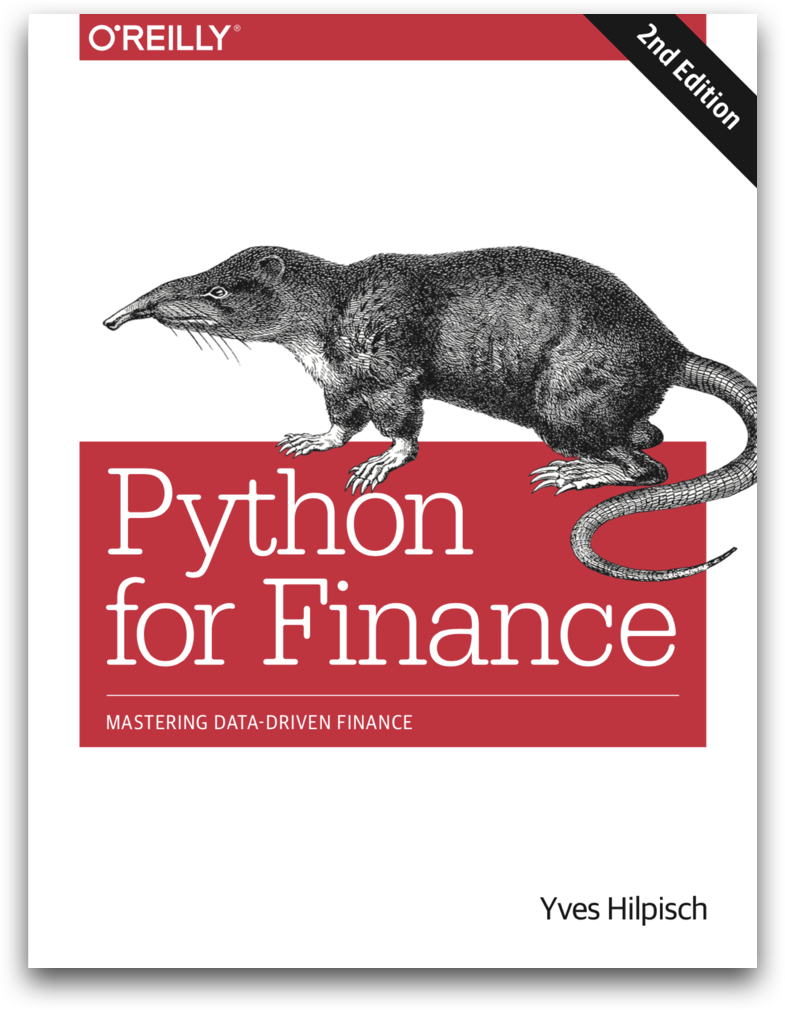
This book, published by O'Reilly in its 2nd edition in 2018 (see http://py4fi.tpq.io), is a general introduction to Python for Finance. The book shows how to set up a proper Python infrastructure, explains basic Python techniques and packages and covers a broader range of topics important in financial data science (such as visualization) and computational finance (such as Monte Carlo simulation).
The third part of the book explains and implements a sub-set of the classes and functions of DX Analytics as a larger case study (about 100 pages).
This books provides you with the basic and advanced Python knowledge needed to do Python for Finance and to apply (and maybe integrate, enhance, improve) DX Analytics.
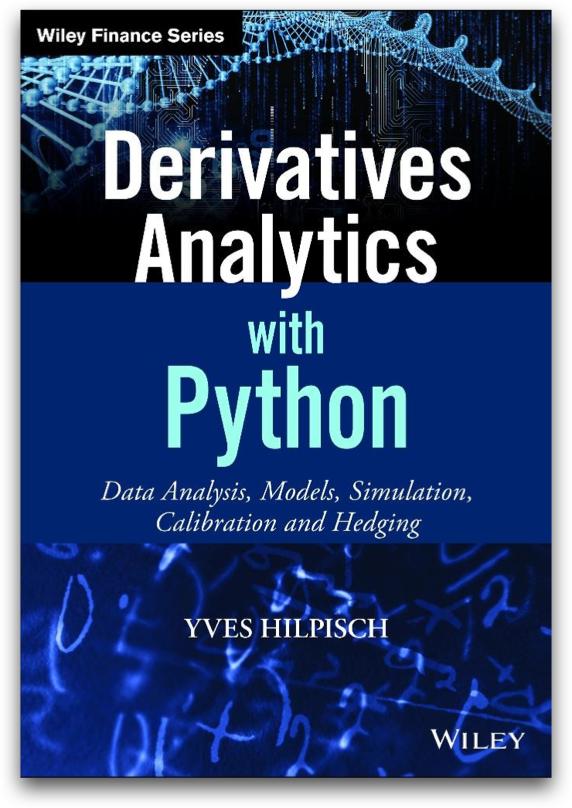
This book — published by Wiley Finance (see http://dawp.tpq.io) with the sub-title "Data Analysis, Models, Simulation, Calibration, Hedging" — introduces to the market-based valuation of financial derivatives and explains what models can be used (e.g. stochastic volatility jump diffusions), how to discretize them and how to simulate paths for such models. It also shows how to calibrate those models parametrically to market observed option quotes and implied volatilities. In addition, the book covers basic numerical hedging schemes for non-vanilla instruments based on advanced financial models. The approach is a practical one in that all topics are illustrated by a self-contained set of Python scripts.
This book equips you with the quantitative and computational finance knowledge needed to understand the general valuation approach and to apply the financial models provided by DX Analytics. For example, the book intensively discusses the discretization and simulation of such models like the square-root diffusion of Cox-Ingersoll-Ross (1985) or the stochastic volatility model of Heston (1993) as well as their calibration to market data.
One of the most simple and efficient ways to start using DX Analytics is by registering for the Quant Platform under http://pqp.io.
After registration, you will find a folder in your home directory called dx-analytics. In this folder, you find Jupyter Notebooks which you can open by clicking on one of them and which are the sources for this documentation. You can interactively execute and easily adjust the code and the examples provided there.
You find all you need in the Github repository http://github.com/yhilpisch/dx. Simply clone the directory to your local/remote machine, navigate to the folder and use the notebooks provided. You should also copy the library folder dx to your site-packages directory of your Python distribution for easy importing.
DX Analytics has no dependencies apart from a few standard libraries (e.g. NumPy, pandas, SciPy, matplotlib.)
You can also install the package via
pip install git+https://github.com/yhilpisch/dx.git
Although the focus of DX Analytics lies on the simulation and valuation of derivatives instruments and portfolios composed thereof, there is still "so much" missing alone in this particular area (given the broadness of the field) that a comprehensive list of missing pieces is impossible to compile. Some major features missing are, for example:
- support for multi-currency derivatives and portfolios
- several features to model more exotic payoffs (e.g. barriers)
- standardized model calibration classes/functions
- more sophisticated models for the pricing of rate-sensitive instruments
To put it the other way round, the strengths of DX Analytics at the moment are the modeling, pricing and risk management of single-currency equity-based derivatives and portfolios thereof. In this regard, the library has some features to offer that are hard to find in other libraries (also commercial ones).
In that sense, the current version of DX Analytics is the beginning of a larger project for developing a full-fledged derivatives analytics suite — hopefully with the support of the Python Quant Finance community. If you find something missing that you think would be of benefit for all users, just let us know.
Technically speaking, a comprehensive test suite (and general approach) for DX Analytics is also missing. This is partly due to the fact that there are infinite possibilities to model derivatives instruments and portfolios with DX Analytics. The ultimate test would be to have a means to judge for any kind of model and valuation run whether the results are correct or not. However, with DX Analytics you can model and value "things" for which no benchmark values (from the market, from other models, from other libraries, etc.) exist.
You can think of DX Analytics a bit like of a spreadsheet application. Such tools allow you to implement rather complex financial models, e.g. for the valuation of a company. However, there is no "guarantee" that your results are in any (economic) way correct — although they might be mathematically sound. The ultimate test for the soundness of a valuation result will always be what an "informed" market player is willing to pay for the instrument under consideration (or a complete company to this end). In that sense, the market is always right. Models, numerical methods and their results might be wrong for quite a large number of reasons.
And when you think of DX Analytics, potential or real implementation errors might of course also play a role, especially since the whole approach to modeling and valuation followed by DX Analytics is far away from being mainstream.
Fortunately, there are at least some ways to implement sanity checks. This is, for example, done by benchmarking valuation results for European call and put options from Monte Carlo simulation against valuation results from another numerical method, in particular the Fourier-based pricing approach. This alternative approach provides numerical values for benchmark instruments at least for the most important models used by DX Analytics (e.g. Heston (1993) stochastic volatility model).
Yves Hilpisch, the author of DX Analytics, is managing partner of The Python Quants GmbH (Germany). The group provides professional support for the DX Analytics library. For inquiries in this regard contact [email protected].
The Python Quants offer a diverse set of Python for Finance online training courses, classes and certificates:
The Python Quants also provide the Quant Platform as a solution for browser-based, interactive, collaborative financial analytics (see http://pqp.io). On this platform (for which free trials are available) you can also immediately use DX Analytics.
You find the documentation under http://dx-analytics.com.
© Dr. Yves J. Hilpisch | The Python Quants GmbH
DX Analytics (the "dx library" or "dx package") is licensed under the GNU Affero General Public License version 3 or later (see http://www.gnu.org/licenses/).
DX Analytics comes with no representations or warranties, to the extent permitted by applicable law.
http://tpq.io | [email protected] | http://twitter.com/dyjh
Quant Platform | http://pqp.io
Python for Finance Training | http://training.tpq.io
Certificate in Computational Finance | http://compfinance.tpq.io
Derivatives Analytics with Python (Wiley Finance) | http://dawp.tpq.io
Python for Finance (2nd ed., O'Reilly) | http://py4fi.tpq.io


