This project defines custom Promster images to work with specific metrics defined by the Big Brother project.
The out of the box supported metrics are:
request_seconds_bucket{type, status, isError, method, addr, le}
request_seconds_count{type, status, isError, method, addr}
request_seconds_sum{type, status, isError, method, addr}
response_size_bytes{type, status, isError, method, addr}
dependency_up{name}
application_info{version}
These metrics can be easily generated with Big Brother's monitor libraries. Please check them out at the the main project.
BB Promster is an extension to Flavio Stutz's Promster, a powerfull tool to automatically identify new service instances to scrape.
It is highly configurable and one can do with it pretty much anything that can be accomplished with Prometheus.
On the other side, the knowledge gap is a bit too steep for a professional with no observability training to start using Promster properly.
The Big Brother Promster, or just BB Promster, comes to solve this issue by aggregating in one place the needed semantics to correctly monitor your application.
The BB Promster should be used in the context of the Big Brother project, where it is assumed that your service:
-
publishes your metrics at a
/metricsendpoint; -
have all the big-brother metrics listed above exposed;
-
with the help of our etcd-registrar or etcd-registry, registers itself at an etcd cluster for automatic scraping;
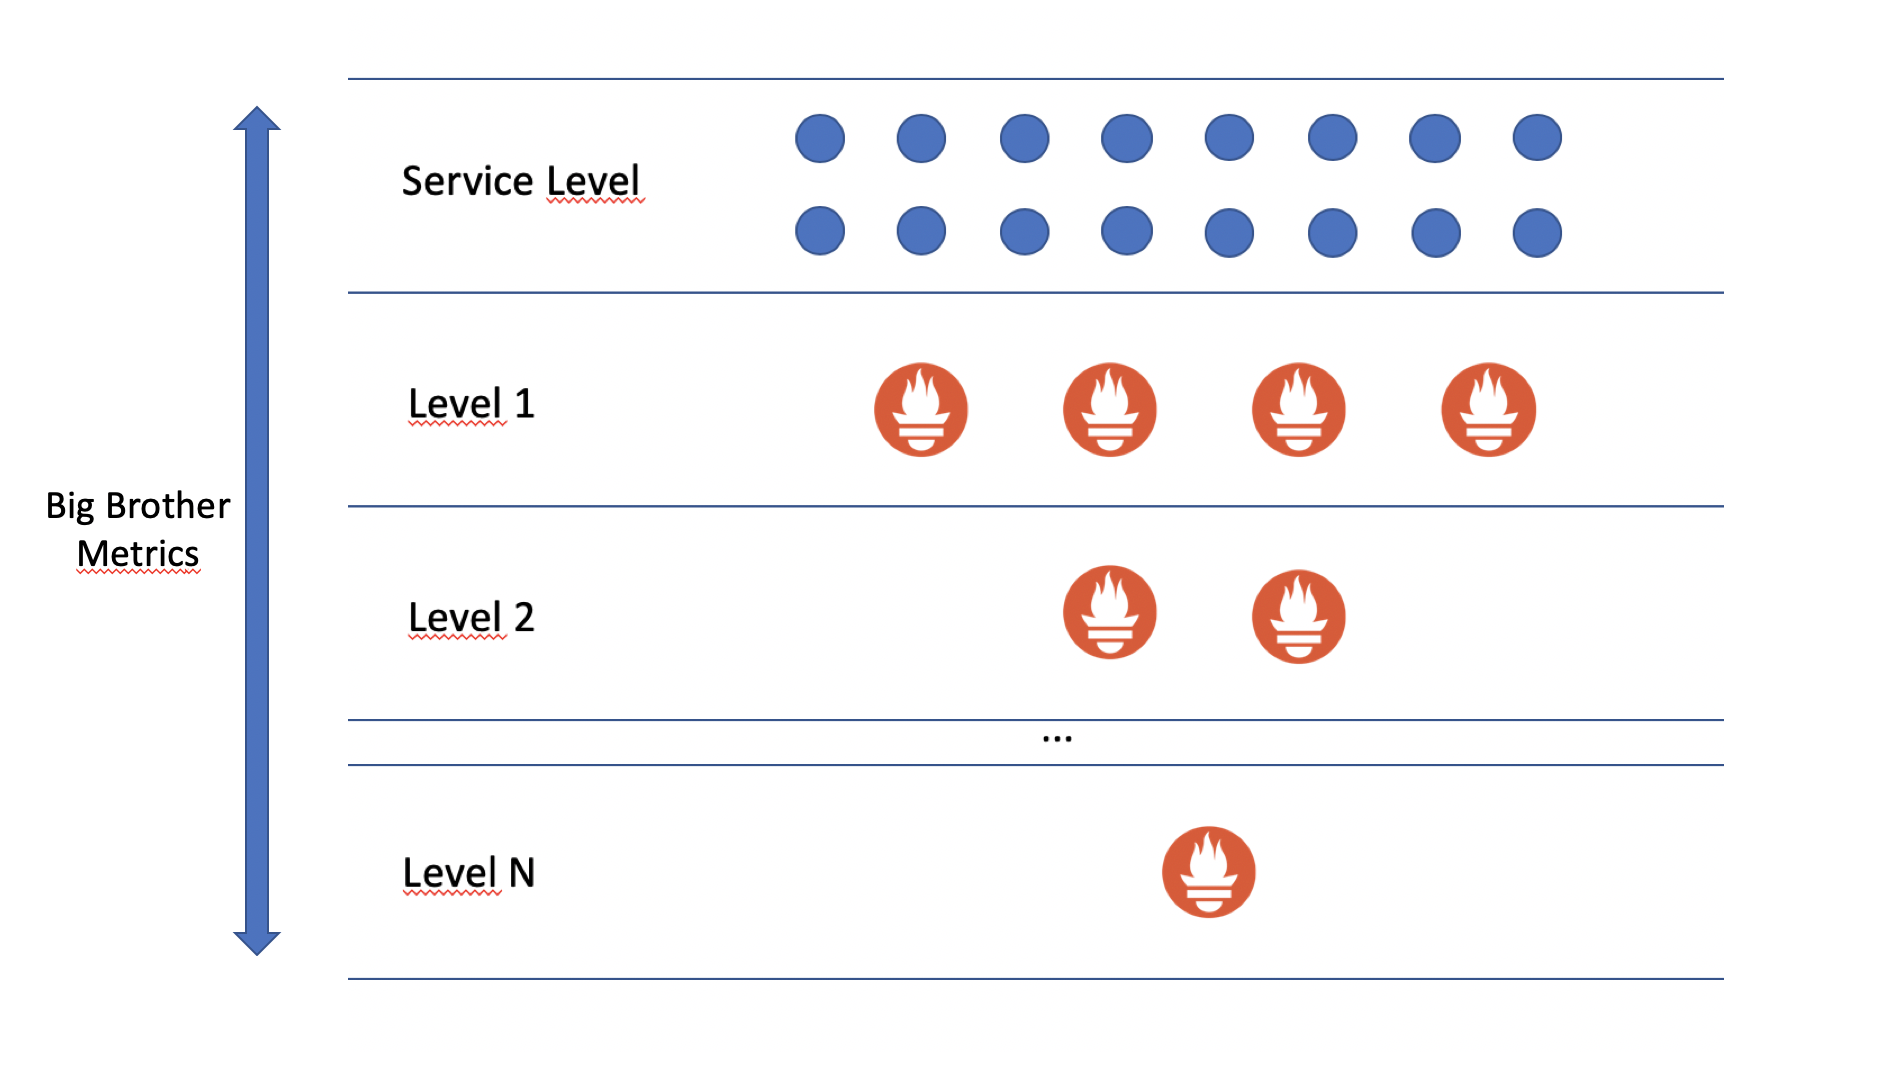
The BB Promster also leverages the federation features implemented by Promster (and Prometheus), allowing your observability cluster to scale together with your service instances.
Prometheus federation is the concept of clustering prometheus instances to allow the handling of huge metric loads.
Ultimately, it ends up in a tree layout with a top-layer, any number of middle layers, and an end layer of prometheus hitting your /metrics endpoint directly.
The BB Promster docker image expects at least four different configurations:
-
BB_PROMSTER_LEVEL: defines the level where a Promster instance lays on at your own Promster cluster topology. Level 1 is for BB-Promsters that hit your
/metricsendpoint directly; Level 2+ is for Promsters that federate on each other. The federation happens for scalability issues. Once you have to scale up your app, things need to work a little bit differently. BB-Promster comes to solve those issues setting up by the default the appropriate recording rules; -
ETCD_URLS: defines the etcd cluster urls where service discovery is done for monitoring purposes. Here we assume that scraping instances and Promster instances will all register themselves at the same etcd registry. Important: all registered IPs or addresses must provide only the host name, without schema or paths. The metric paths and schema should be configured by other environment variables;
-
REGISTRY_ETCD_BASE: defines in which base path of the ETCD is grouped all the components to observe a specific application;
-
REGISTRY_SERVICE: defines the name of the service you are observing as defined at the appropriate ETCD record;
-
SCRAPE_ETCD_PATH: this information tells level 1 BB-Promsters where to find the targets IP addresses at the provided ETCD installation. Important: Mandatory only for level 1 BB-Promsters;
If you have a scenario where you have different ETCD clusters, one for registering Scraping instances and other for registering Promster instances, you can leave ETCD_URLS empty and define the following ENVs:
-
REGISTRY_ETCD_URL: the etcd cluster urls where a Promster instance will register itself for federation;
-
SCRAPE_ETCD_URL: the etcd cluster urls where a service instance will register itself for scraping;
-
TLS_INSECURE: informs Prometheus to ignore TLS verification;
-
SCHEME:
http(default) orhttps. Configure your level 1 BB-Promsters if your targets are only exposed athttpsendpoints and do not have automatic redirection fromhttptohttps; -
SCRAPE_PATHS: if your metrics path does not follow the default
/metrics, you'll need to configure this variable to point to the exact path where your metrics are exposed; -
CLEAR_RR: the recording rules can be all removed if you wish. Just set the
CLEAR_RRenv totrueandbb-promsterwill have it's set of recording rules deleted; -
ALERT_MANAGER_URLS: if you have a configured alertmanager at your disposal, you can set BB Promster to leverage it by using the provided
ALERT_MANAGER_URLSenvironment variable. Only Level 1 BB Promster will have the alerting rules installed and the alert manager urls properly configured. This is to disable redundant alerting;
All other configurations from Promster itself and Prometheus are still available for use. We recommend, though, to use them with care and always checking for conflicts with our env resolution logic implemented in run.sh.
The BB-promster allows you to update alert-rules templates based on prod_version and pilot_version registered on etcd. It's useful to easily create and update comparative alerts between versions. To use this functionality, you need to:
-
Define the env ALERT_RULES_FILE equals to
/etc/prometheus/comparative-alerts.ymlin yourdocker-compose.ymlfile. -
Create an
alert-rules.yml.tmplinside thealert_rulesfolder. The valid variables for the template are.PilotVersionand.ProdVersion. You can find an alert template file example here. -
Run bb-promster project.
-
Register
prod_versionin etcd, passing/versions/$REGISTRY_SERVICE/prod_version/version_number. For example:etcdctl put /versions/example-1/prod_version/v0001. -
Register the
pilot_versionin etcd, passing/versions/$REGISTRY_SERVICE/pilot_version/version_number. For example:etcdctl put /versions/example-1/pilot_version/v0002.
Once a prod_version and a pilot_version are registered in etcd, the template file will be loaded in Prometheus as an alert rules file. When a new version was registered in etcd, the alert rule will be reloaded with the new version.
This repository also comes with an example. Just go to your terminal and type:
> docker-compose up
This will lauch 4 services:
-
an etcd registry;
-
two metrics generator services with IPs registered at the
/metrics-generator/ETCD path; -
two a level 1 bb-promster instances that will scrape the exposed metrics at the services'
/metricsendpoint; -
two level 2 bb-promster instances that will federate the right level 1 bb-promster instances;
With this setup you can exercise some scenarios, such as:
-
scaling up your service;
-
scaling up level 1 bb-promster;
A cortex example was added to the cortex folder as a proof-of-concept.
To experiment with it, you need to have a valid/configured cassandra instance running on your host. You can run it by executing:
docker run -d --name cassandra --rm -p 9042:9042 cassandra:3.11Wait a bit for Cassandra to normalize (usually 30s). After that, configure your cortex cassandra KEYSPACE by first entering a valid CQLSH session with docker exec -it cassandra cqlsh and then executing:
CREATE KEYSPACE cortex WITH replication = {'class':'SimpleStrategy', 'replication_factor' : 1};After successfully configuring your cassandra, you can just docker-compose up -d from the cortex folder.
The cortex startup time can be really slow due to Ingester ring synchronization routines, so you should wait a bit (from 2 minutes up until 10).
You will know cortex is up and running when hitting http://localhost:9001/ring at your browser lists the available Ingesters.
You can also check your cortex logs for the following message:
level=info ts=2020-02-19T12:51:33.3486187Z caller=main.go:100 msg="Starting Cortex" version="(version=, branch=, revision=)"
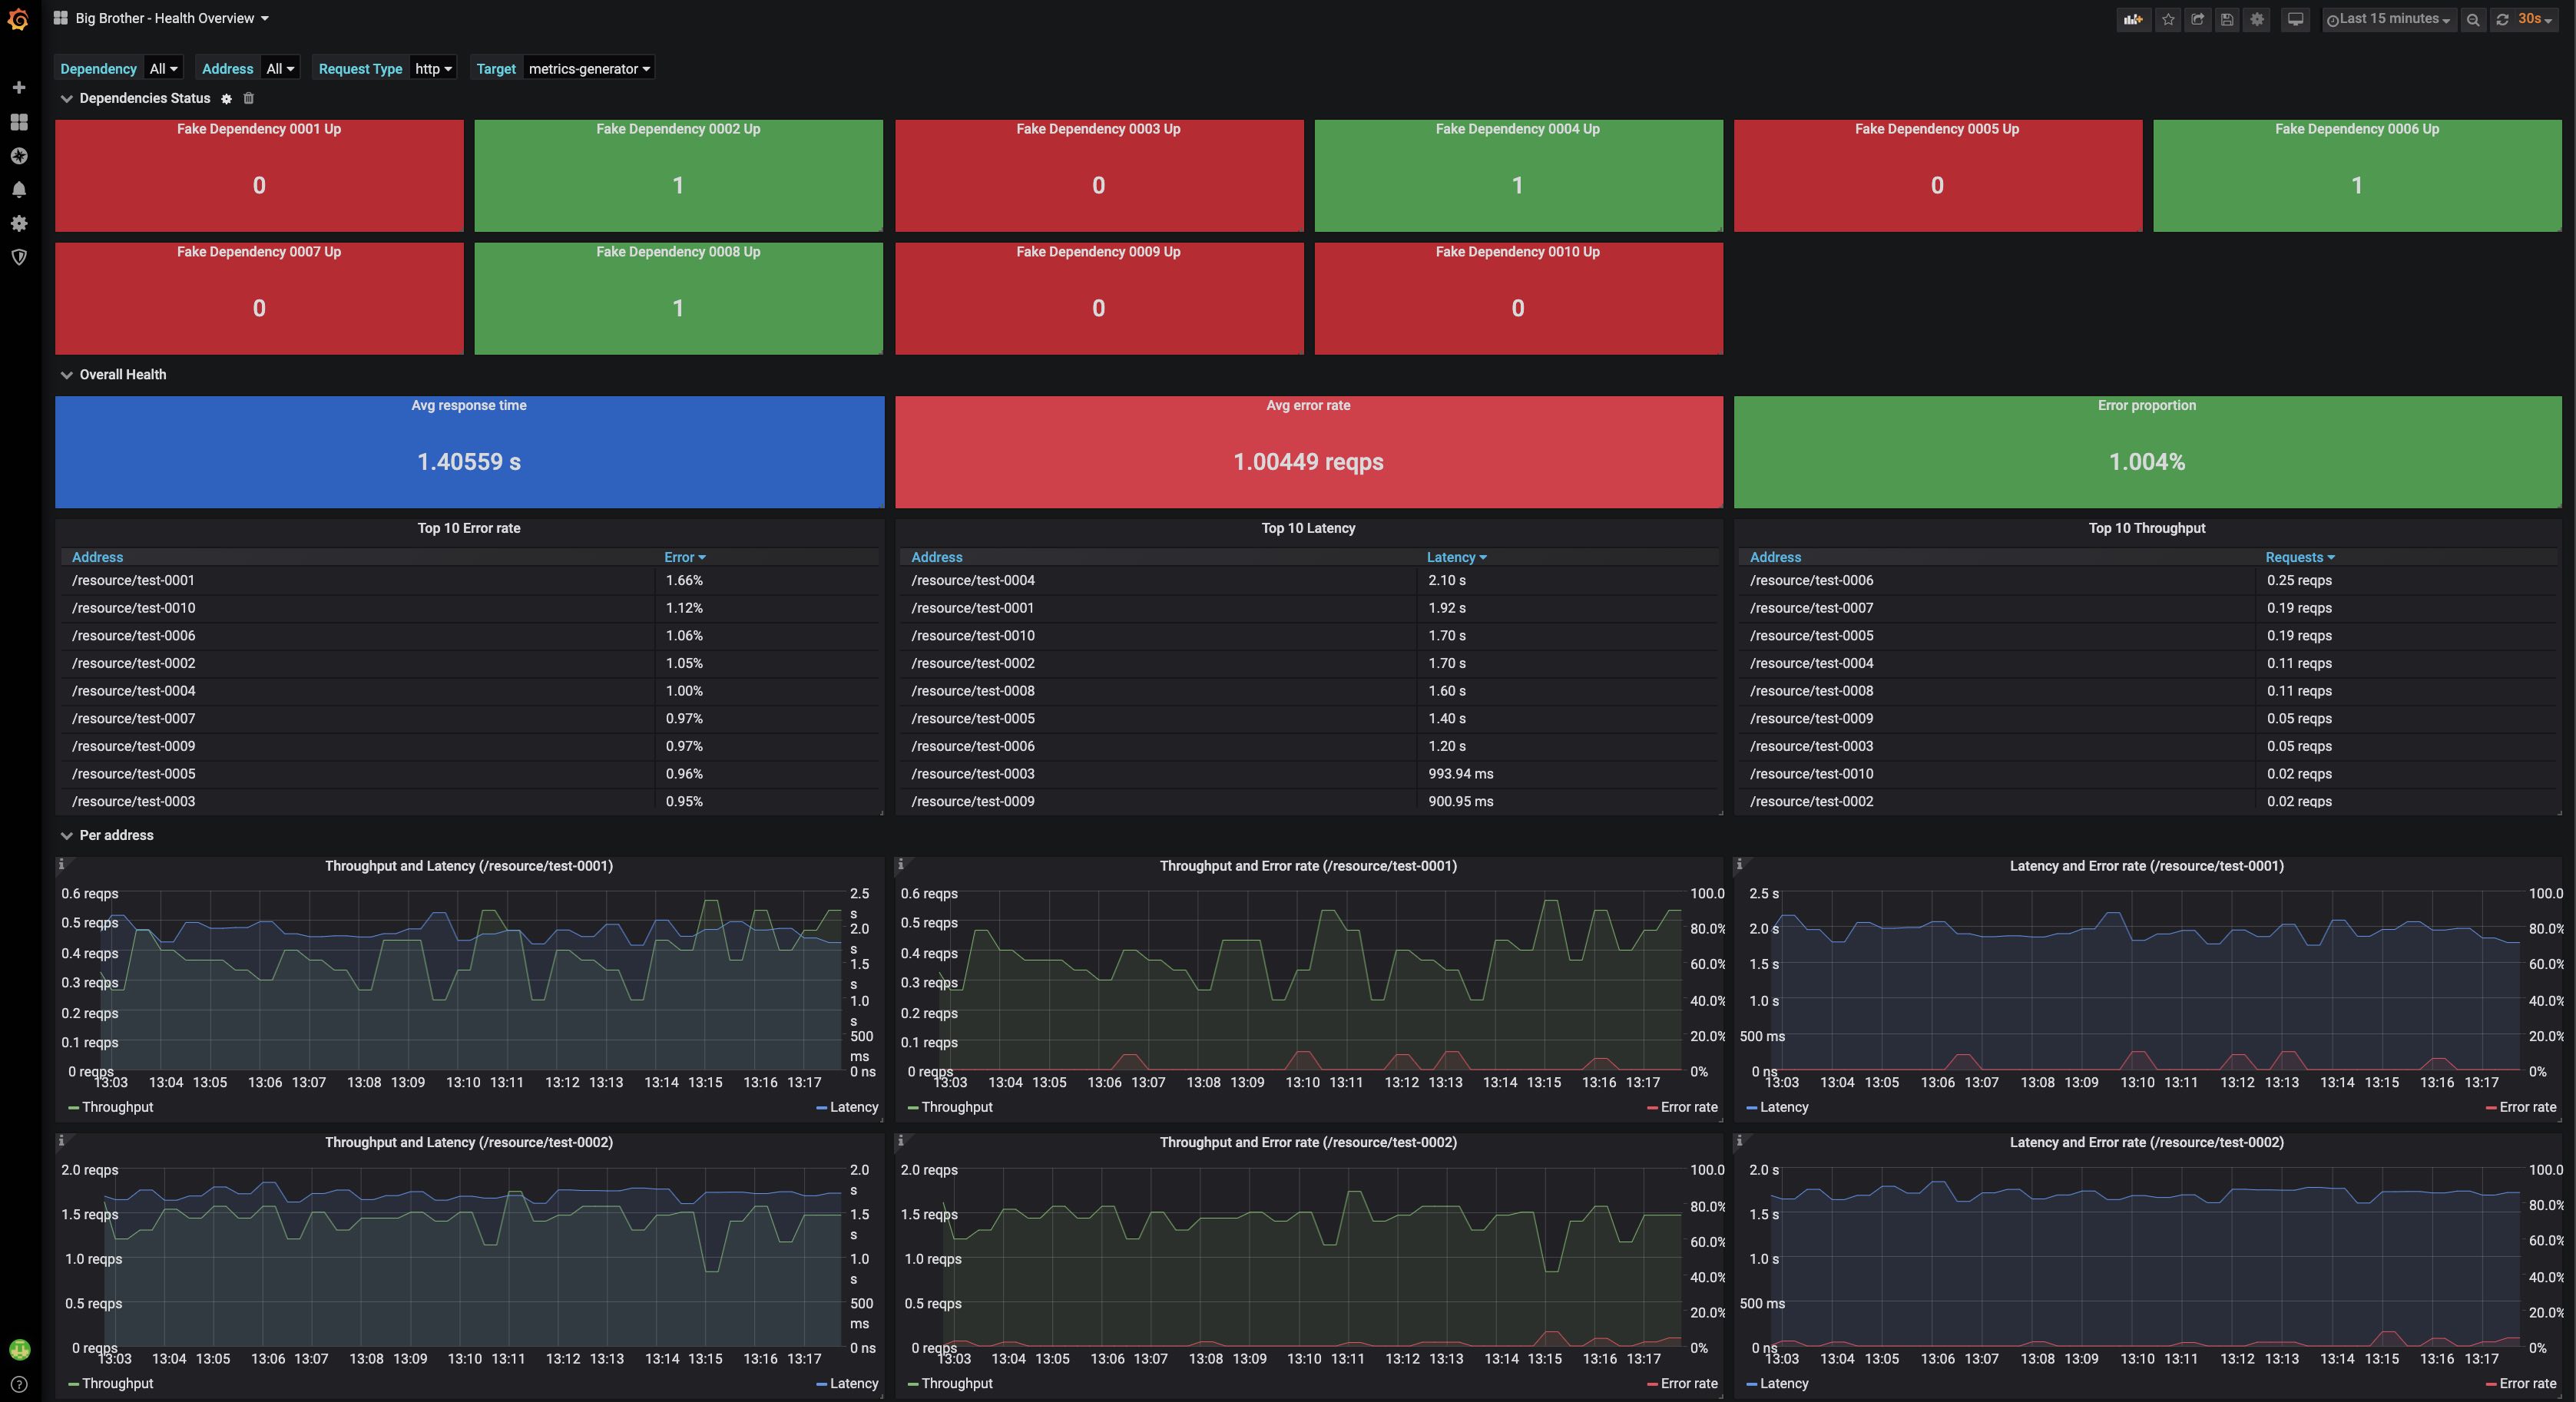
After everything is up and running, go to your web browser at http://localhost:3000, add the Prometheus Cortex datasource (http://cortex1:9009/api/prom) and import our Big Brother grafana dashboard with ID 11544.
You should see something like the following:
This is part of a more large application called Big Brother.


