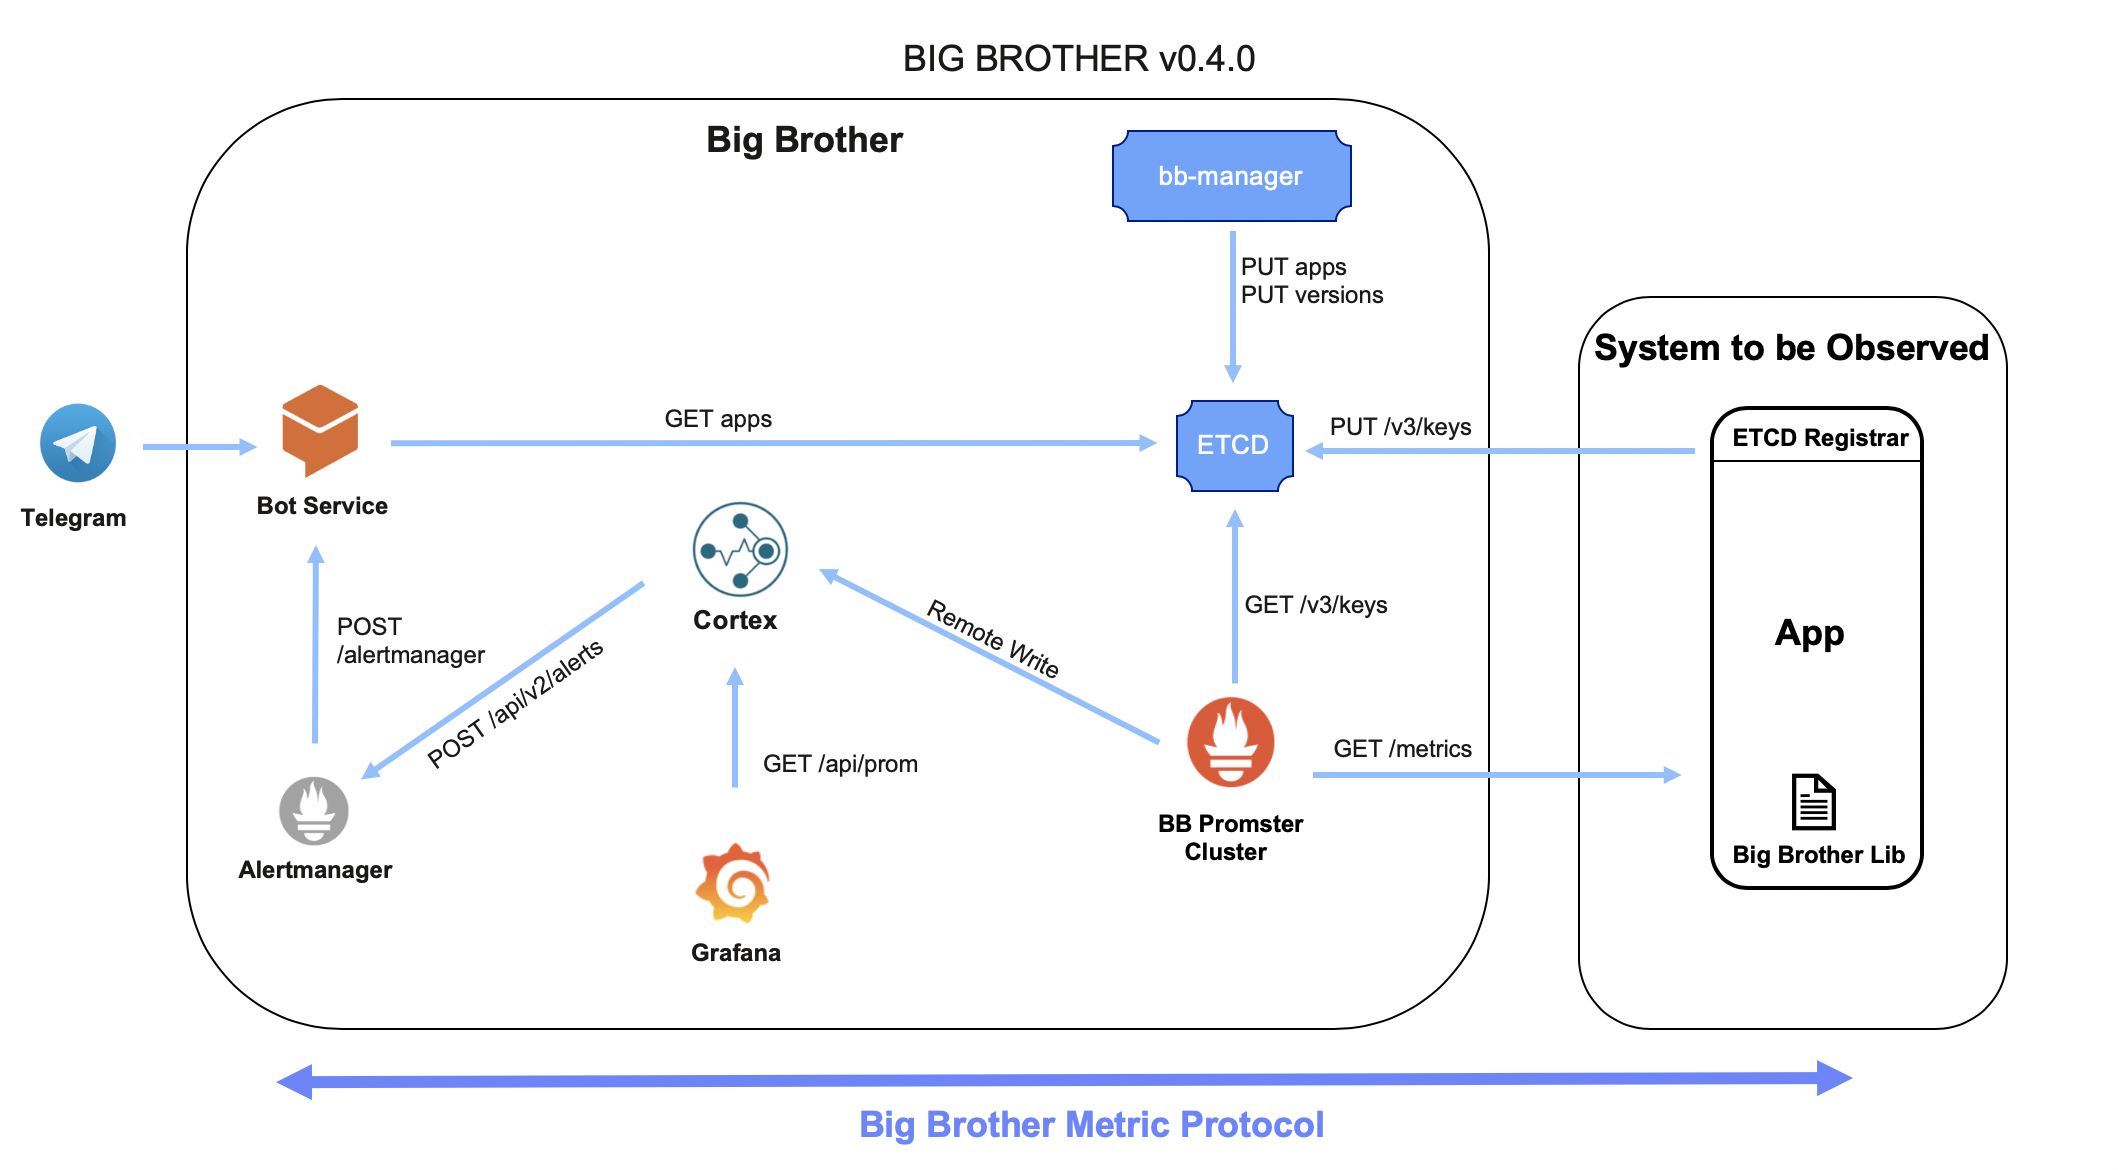
This project defines a service to effectively communicate observability events to application stakeholders.
Basically, it collects the necessary metrics from a client provided BB Promster cluster endpoint.
More specifically, the Cortex app monitors and stores metrics sent by the BB Promster Clusters, and starts collecting Big Brother specific metrics, with the help of some useful programming libraries.
These metrics are treated as the fundamental protocol behind Big Brother's capabilities.
A valid Big Brother library should expose the following metrics:
request_seconds_bucket{type, status, isError, errorMessage, method, addr, le}
request_seconds_count{type, status, isError, errorMessage, method, addr}
request_seconds_sum{type, status, isError, errorMessage, method, addr}
response_size_bytes{type, status, isError, errorMessage, method, addr}
dependency_up{name}
dependency_request_seconds_bucket{name, type, status, isError, errorMessage, method, addr, le}
dependency_request_seconds_count{name, type, status, isError, errorMessage, method, add}
dependency_request_seconds_sum{name, type, status, isError, errorMessage, method, add}
application_info{version}
In detail:
request_seconds_bucketis a metric that defines the histogram of how many requests are falling into the well defined buckets represented by the labelle;request_seconds_countis a counter that counts the overall number of requests with those exact label occurrences;request_seconds_sumis a counter that counts the overall sum of how long the requests with those exact label occurrences are taking;response_size_bytesis a counter that computes how much data is being sent back to the user for a given request type. It captures the response size from thecontent-lengthresponse header. If there is no such header, the value exposed as metric will be zero;dependency_upis a metric to register weather a specific dependency is up (1) or down (0). The labelnameregisters the dependency name;dependency_request_seconds_bucketis a metric that defines the histogram of how many requests to a specific dependency are falling into the well defined buckets represented by the label le;dependency_request_seconds_countis a counter that counts the overall number of requests to a specific dependency;dependency_request_seconds_sumis a counter that counts the overall sum of how long requests to a specific dependency are taking;- Finally,
application_infoholds static info of an application, such as it's semantic version number;
For a specific request:
typetells which request protocol was used (e.g.grpc,http, etc);statusregisters the response status (e.g. HTTP status code);methodregisters the request method;addrregisters the requested endpoint address;versiontells which version of your app handled the request;isErrorlets us know if the status code reported is an error or not;errorMessageregisters the error message;nameregisters the name of the dependency;
The following libraries make part of Big Brother official libraries:
express-monitorfor Node JS Express apps;servlet-monitorfor Java Servlets apps;quarkus-monitorfor Java Quarkus apps;flask-monitorfor Python Flask apps;mux-monitorfor the Golang Mux apps;fiber-monitorfor the Golang Fiber apps;gin-monitorfor the Golang Gin apps;- [TODO]
iris-monitorfor Golang Iris apps;
Without these, you would have to expose the metrics by yourself, possibly leading to inconsistencies and other errors when setting up your app's observability infrastructure with Big Brother.
The Big Brother app is composed by an ETCD cluster, a Dialogflow Bot, a Prometheus Alertmanager, a Grafana, a Promster cluster, a Cortex, and a BB Manager, all with their own configuration needs.
The ETCD cluster serves 3 purposes:
- Register client
bb-promsterclusters; - Register versions of the apps, for updating alerts dynamically;
- [TODO] Register Big Brother's alertmanager cluster, for high availability;
Gets configured by:
ETCD_LISTEN_CLIENT_URLS: the addresses ETCD daemon listens to client traffic;ETCD_ADVERTISE_CLIENT_URLS: list of an ETCD client URLs to advertise to the rest of the cluster;
A bot to communicate with the interested stakeholders. It's purposes are to:
- Enable CRUD of client apps to be observed by Big Brother; and
- Alert on possible problems;
A service to host alerting configuration on top of the alerts being dispatched by the Promster Cluster.
Gets configured by:
WEBHOOK_URL: the bot address
A service to generate graphics to help to query, visualize and understand your metrics.
The service that federate's on the client's bb-promster cluster, hosts and evaluates alerting rules and dispatches alerts accordingly.
Gets configured by:
- [TO BE DEPRECATED]
BB_PROMSTER_LEVEL: integer greater than 0 that defines which level this promster sits on it's own federation cluster; ETCD_URLS: defines the ETCD cluster urls, separated by comma;ALERT_MANAGER_URLS: defines the alertmanager cluster urls;
The service that monitors and stores metrics sent by the BB Promster Clusters
A front-end interface to register apps and version.
-
Talk to Telegram's Bot Father, create your own bot and get it's Telegram Token;
-
Open a Dialogflow account, create a new project and import the configs from the folder
bot/dialogflow; -
Train your intents;
-
Setup a Telegram integration with the Token obtained in
step 1; -
Expose your
port 3001and inform a reachable HTTPS address to the Dialogflow fulfillment configuration. We recommend using ngrok for that; -
Type the following commands in your terminal to interact with your bot directly through Telegram:
TELEGRAM_TOKEN=<XXXXX:YYYYYY> docker-compose up -d --build
This will run an example app with its own
bb-promstercluster and the Big Brother app with its components. -
Now go to the bot on Telegram, and add a new App. Inform the App name (e.g.
Example) and the app address (e.g.example-bb-promster:9090). You'll be automatically subscribed to the app you've just added.
[TO BE DEPRECATED] The example client app bb-promster cluster will get registered to the Big Brother's ETCD and Big Brother will then start collecting metrics by federating it.
Open your browser on http://localhost:3000 to access the provided Grafana dashboard (user bigbrother, password bigbrother).
Also, access http://localhost:3001/test on your browser to dispatch test alerts and see if you get them at your Telegram chat.
Follow this tutorial to run using Kubernetes.
The name is inspired by George Orwell's 1984 Big Brother character.
In this book, Big Brother is an entity that is omniconscious, being able to watch everyone, everywhere.
This is exactly what we aim to achieve with this project: a way for you to easily and effectively watch every project you have without any prior knowledge of observability concepts and Prometheus best practices.
