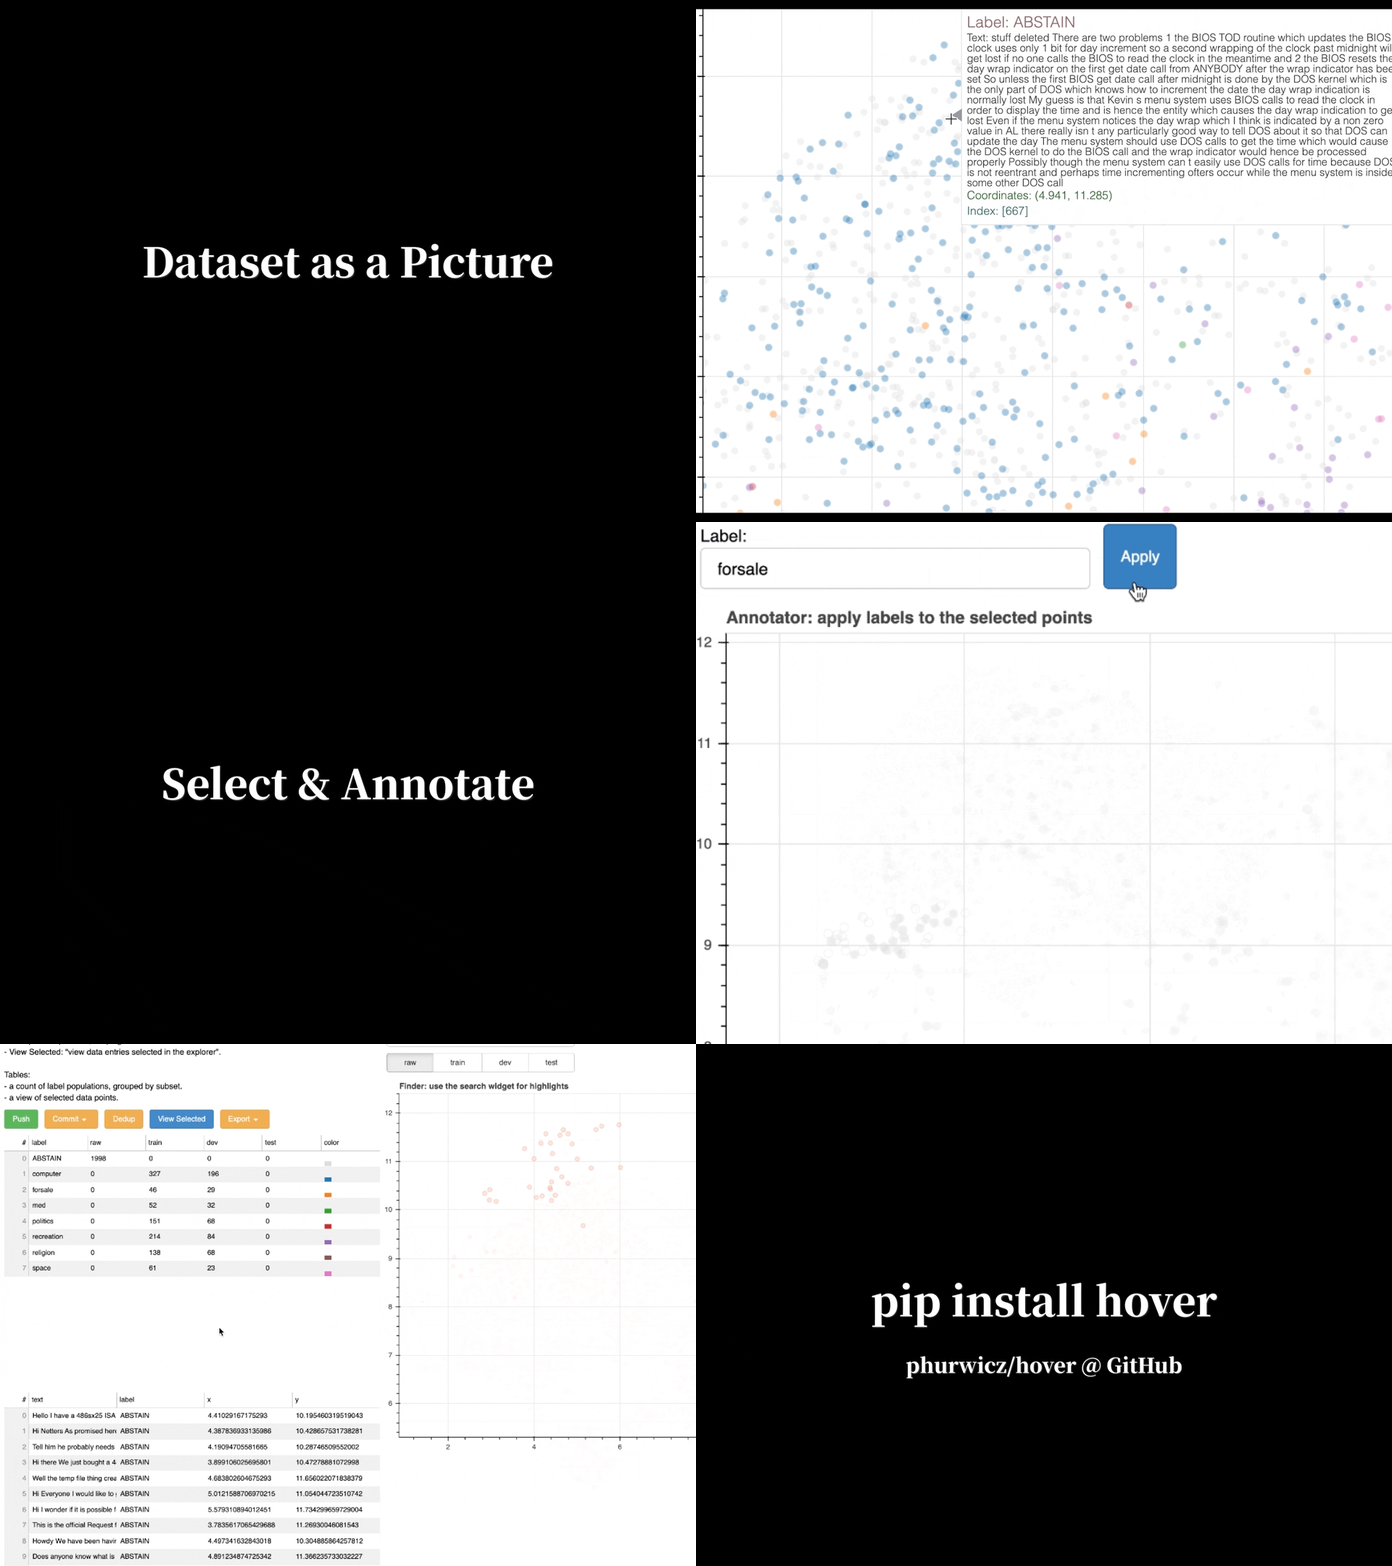
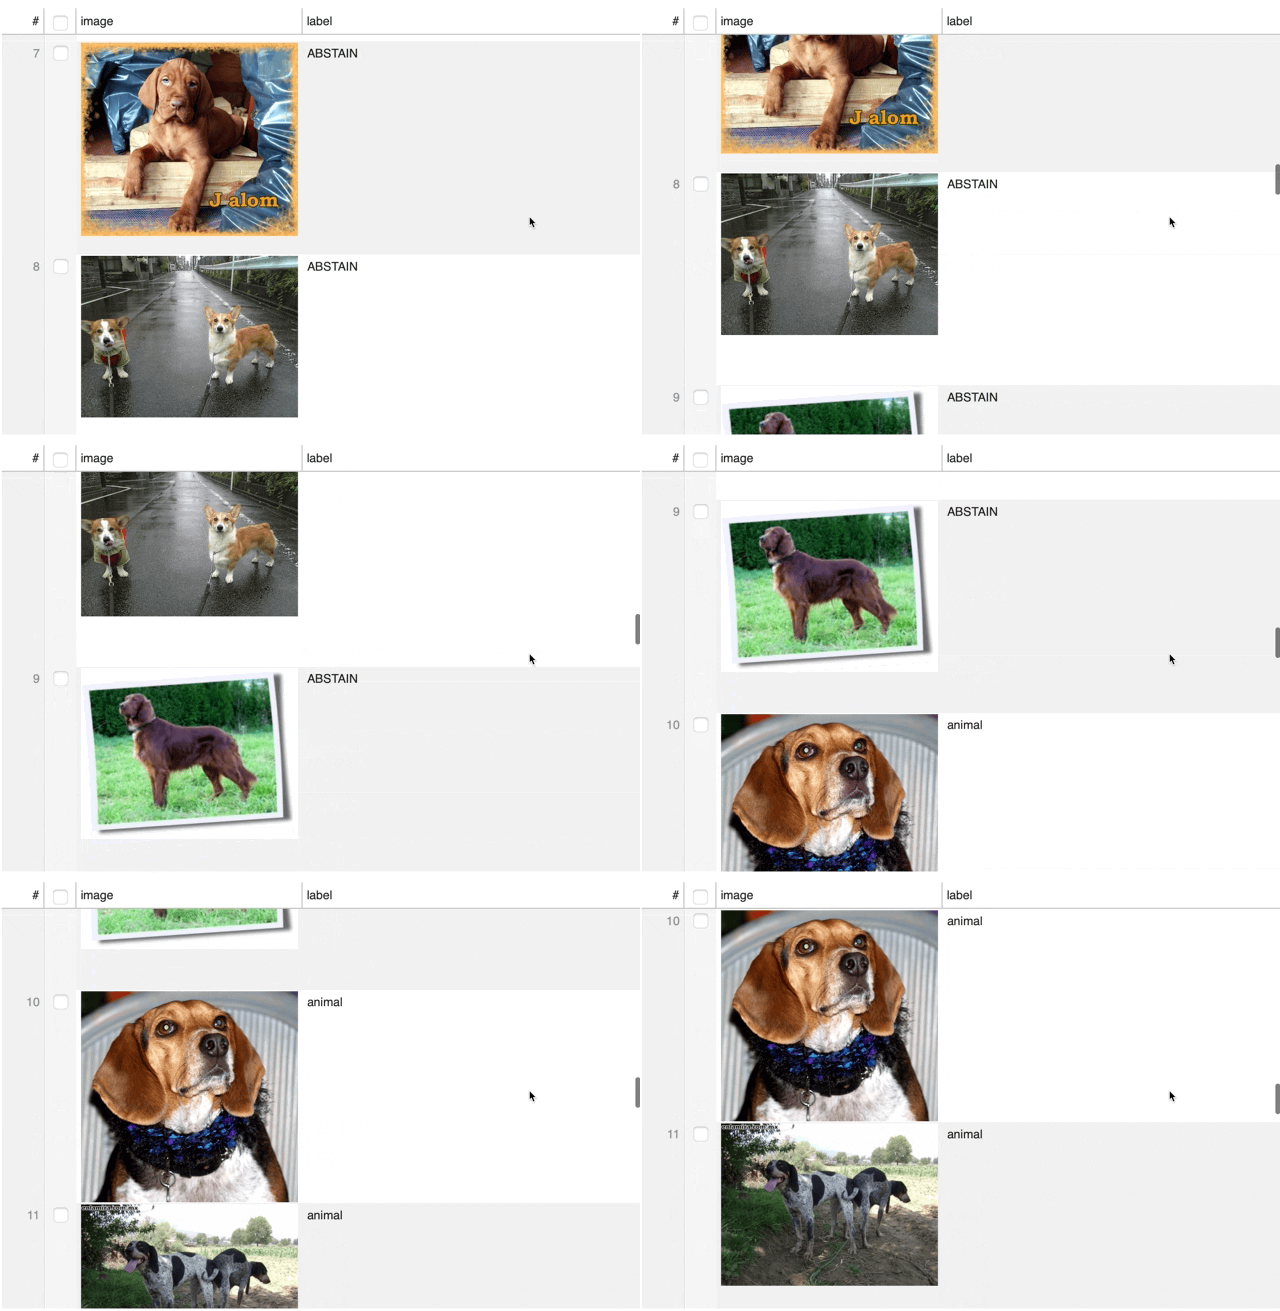
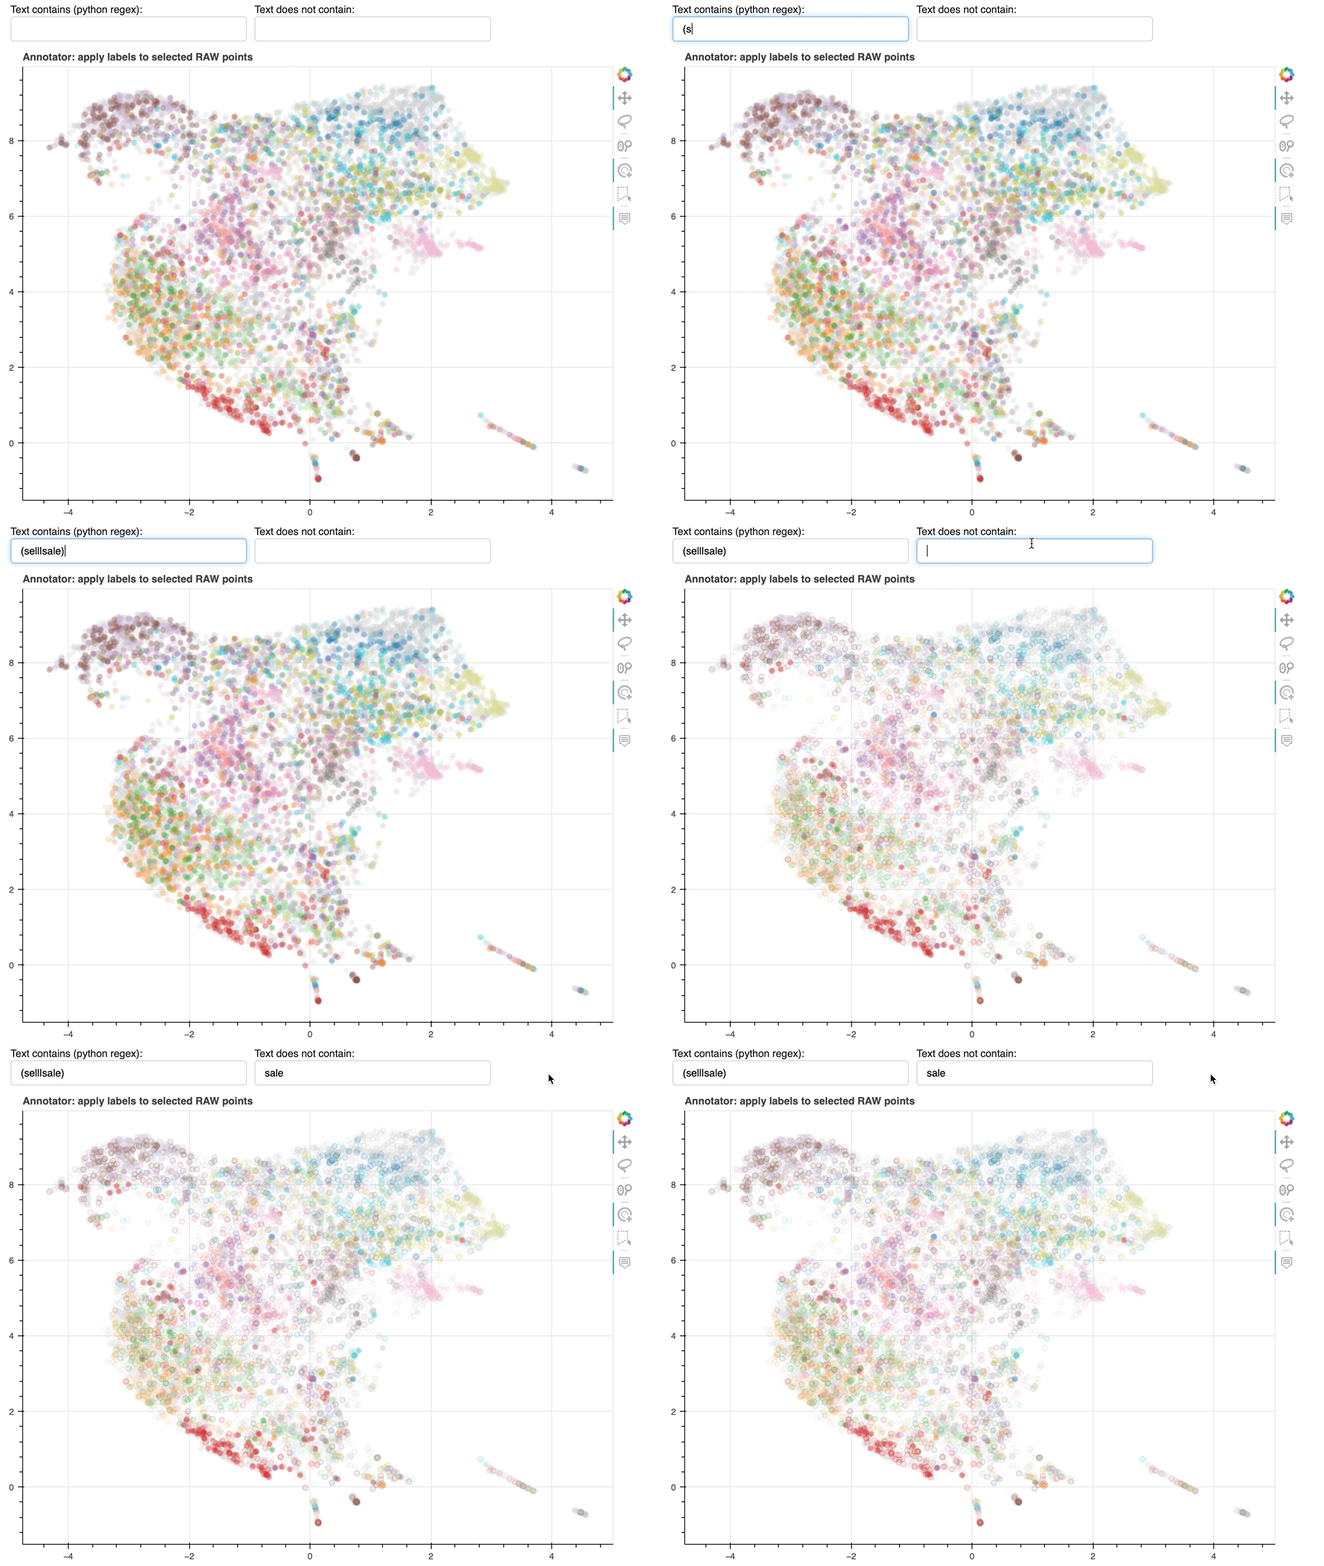
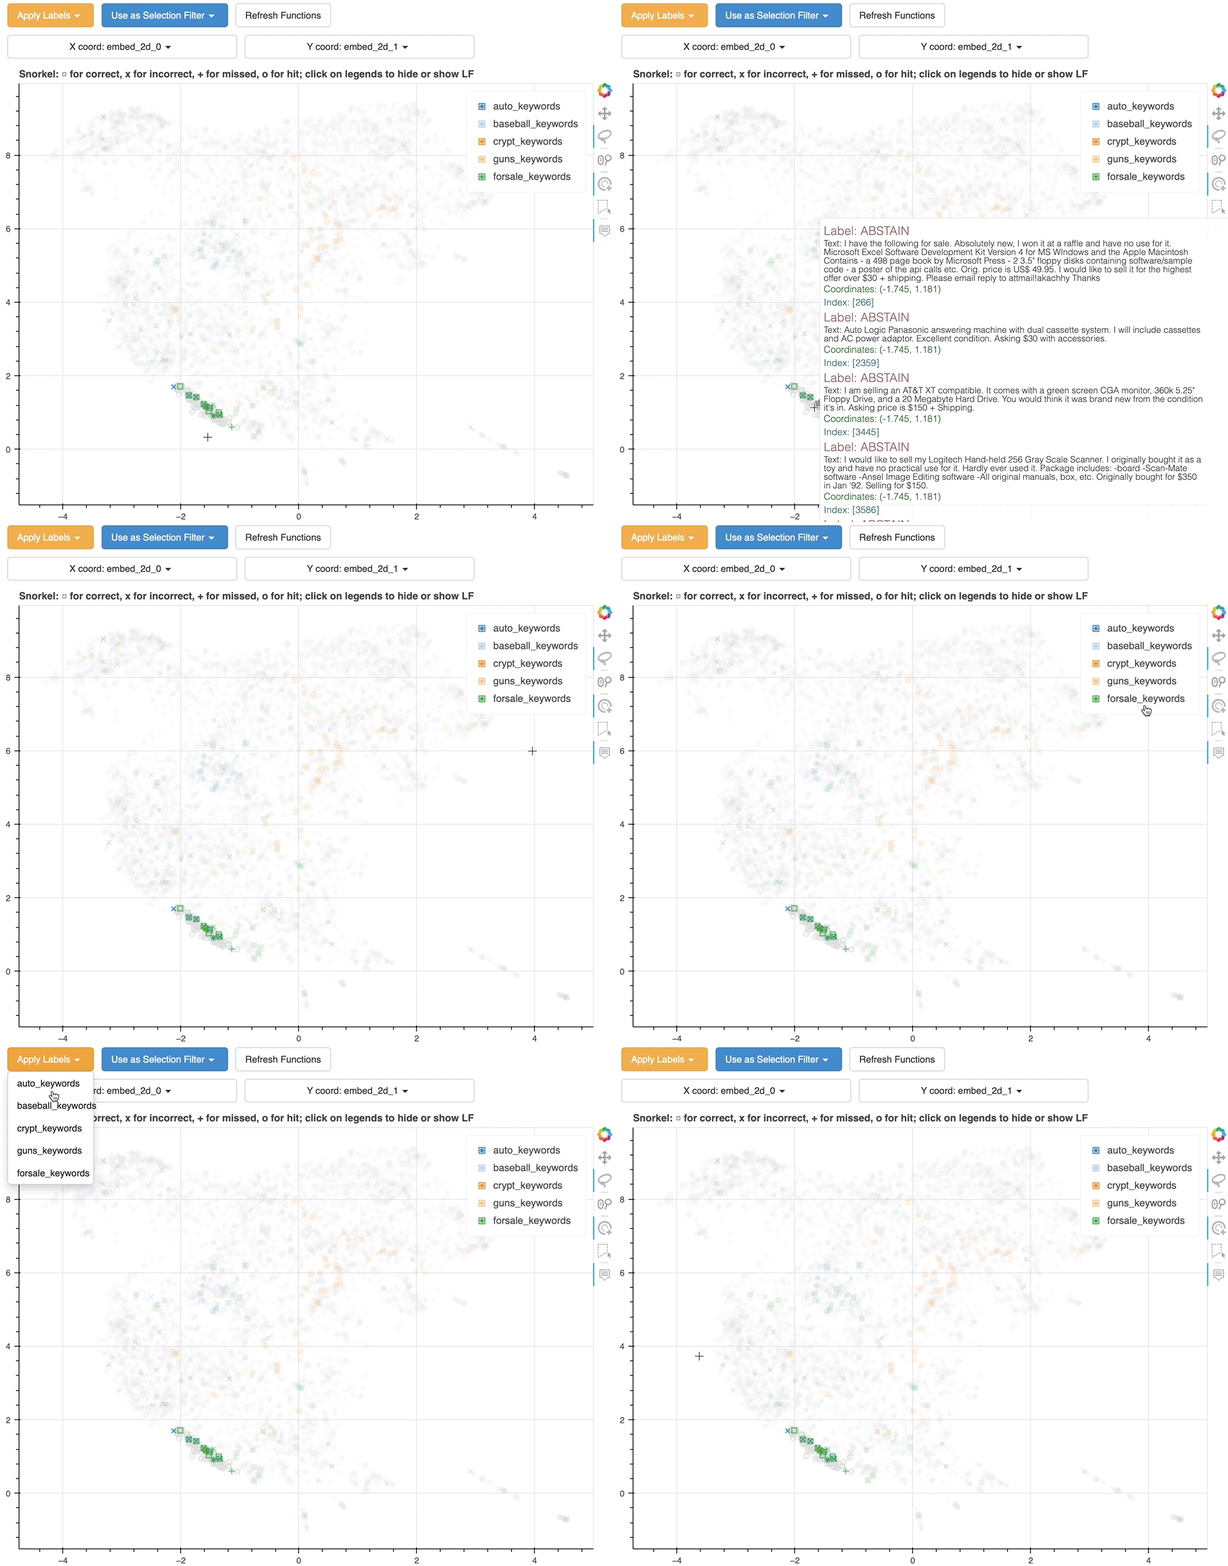
Explore and label on a map of your data.
Get enough to feed your model in no time.
hover is a tool for mass-labeling data points that can be represented by vectors.
- Labeling is as easy as coloring a scatter plot.
- Hover your mouse and lasso-select to inspect any cluster.
- Use a variety of widgets to narrow down further.
- Enter a suitable label and hit "Apply"!
- edit & run code in your browser to get a labeling interface, with guides along the way.
- go directly to an example labeling interface hosted on Binder.
It's fast because it labels data in bulk.
🔭 A semantic scatter plot of your data for labeling, equipped with
It's accurate because multiple components work together.
🔬 Supplementary views to use in conjunction with the annotator, including
It's flexible (and fun!) because the process never gets old.
🧰 Additional tools and options that allow you to
Python: 3.8+
OS: Linux & Mac & Windows
PyPI: pip install hover
Conda: conda install -c conda-forge hover
- Jan 21, 2023 version 0.8.0 is now available. Check out the changelog for details 🥳.
- Thanks to
Bokehbecausehoverwould not exist without linked plots and callbacks, or be nearly as good without embeddable server apps. - Thanks to Philip Vollet for sharing
hoverwith the community even when it was really green.
- All feedbacks are welcome, especially what you find lacking and want it fixed!
./requirements-dev.txtlists required packages for development.- Pull requests are advised to use a superset of the pre-commit hooks listed in .pre-commit-config.yaml.
If you have found hover useful to your work, please let us know 🤗
@misc{hover,
  title={{hover}: label data at scale},
  url={https://github.com/phurwicz/hover},
  note={Open software from https://github.com/phurwicz/hover},
  author={
    Pavel Hurwicz and
    Haochuan Wei},
  year={2021},
}


