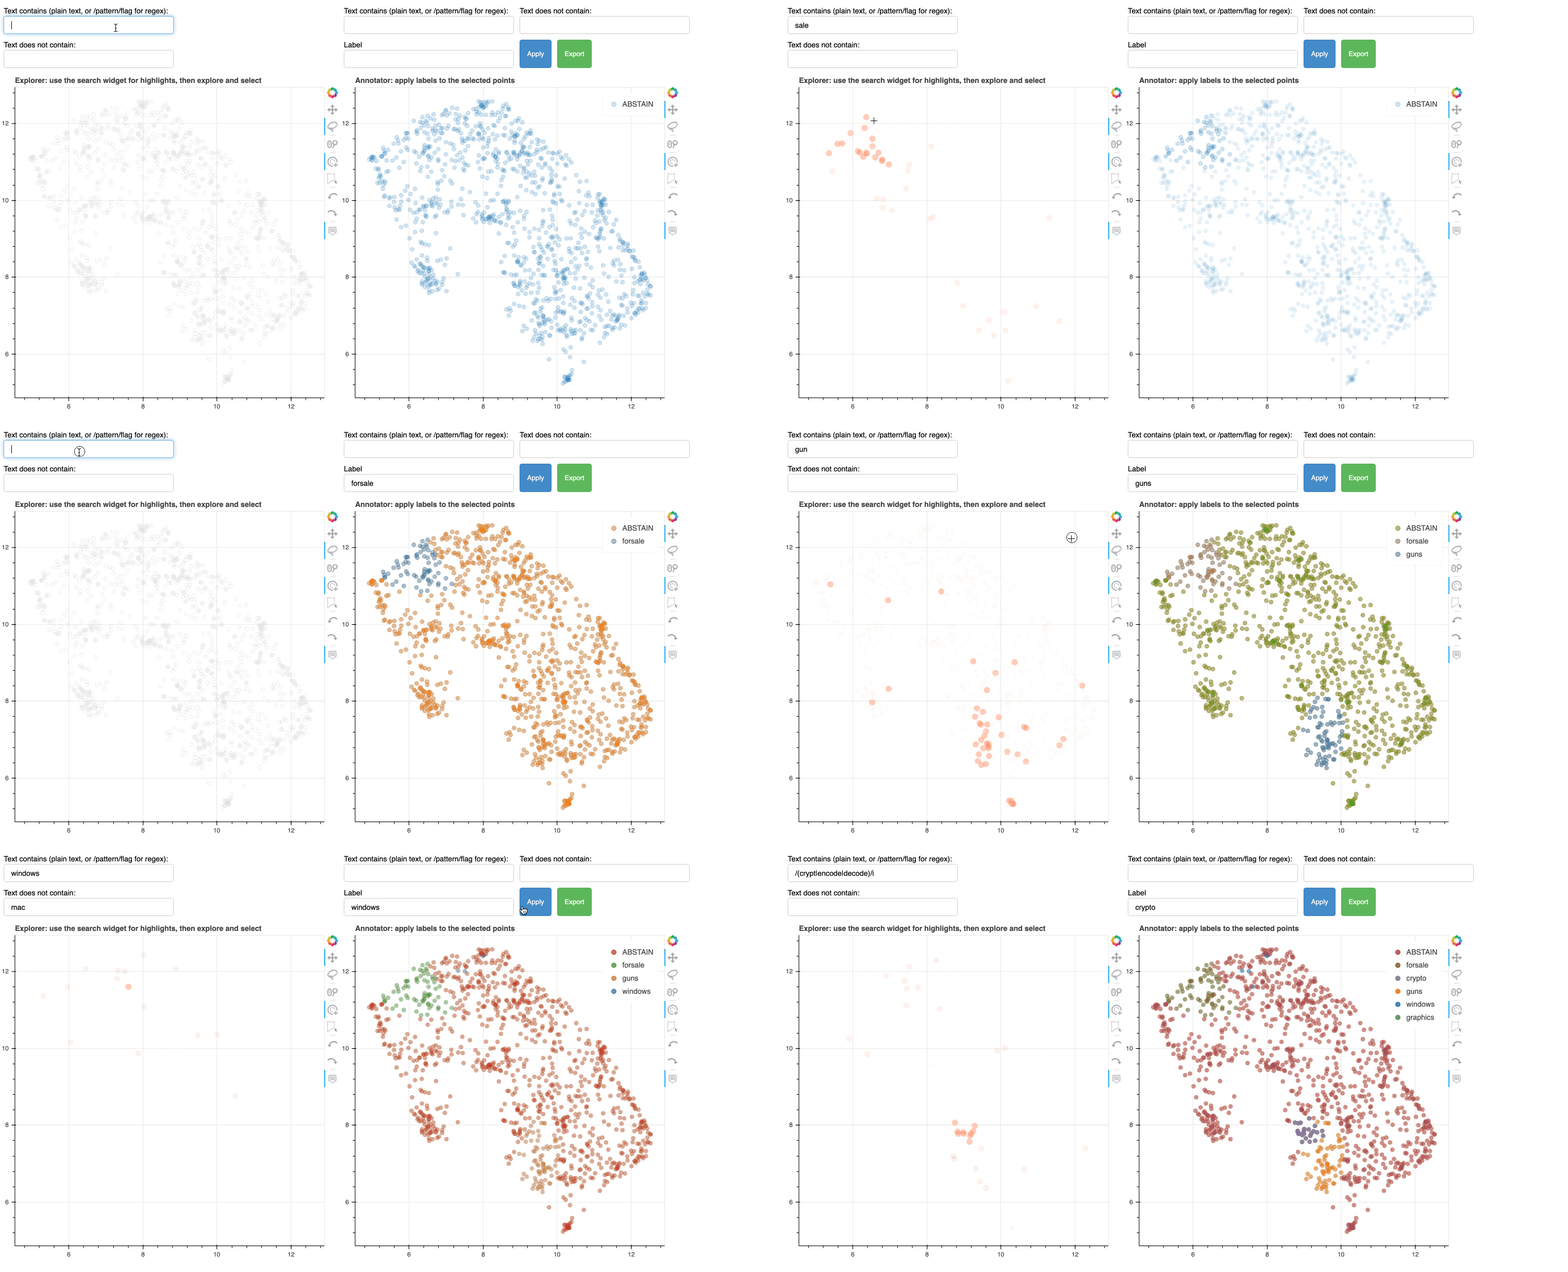
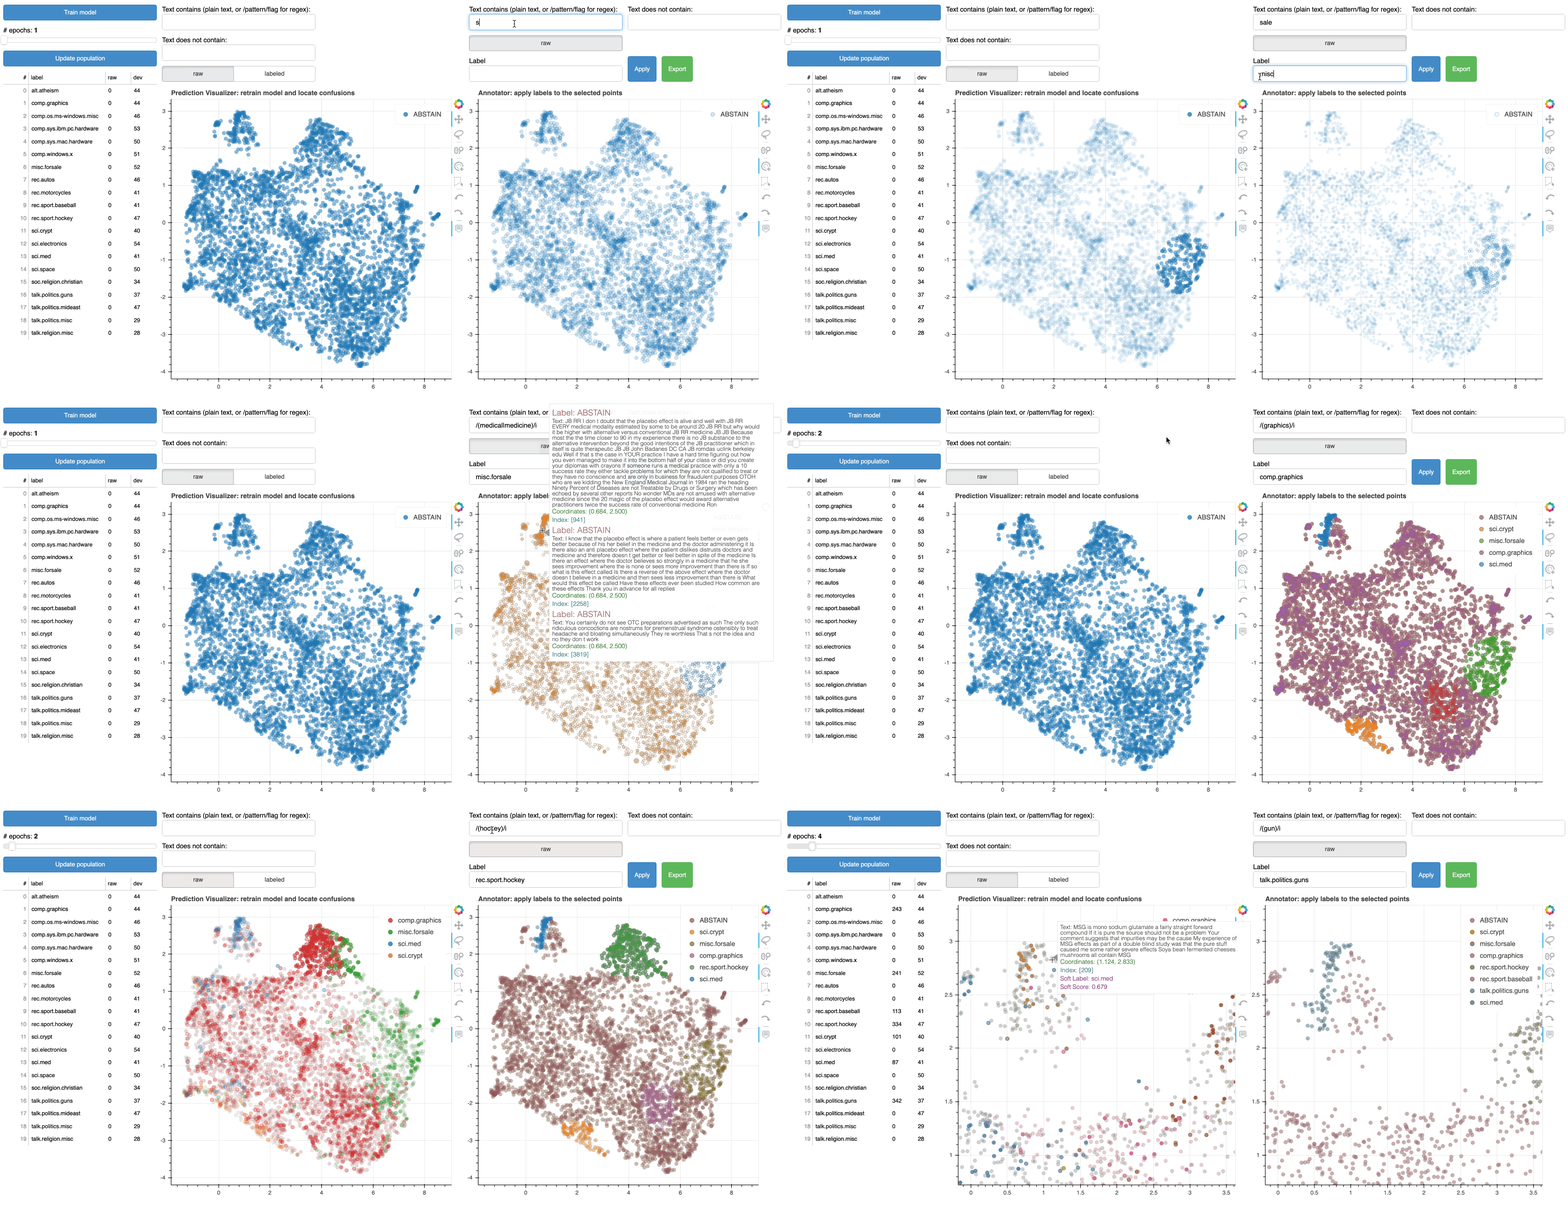
This repository demonstrates the usage of hover to understand and supervise a machine learning classification task.
- use the lasso/tap/poly tool to select data points
- assign your labels and hit "Apply"
- in a real use case on your computer, "Export" will save a DataFrame
- take advantage of the text/regex search box
- on top of the
Simple Annotator, showes another plot which is focused on search - the search boxes are independent across plots, minimizing interference in between
- 💡 the selections in the plots are synchronized. You can select in one and label in the other!
- compared with the
Linked Annotator, added a plot with the predictions of a model in the loop - 💡 inspect data points based on their prediction confidence and locations!
- compared with the
Linked Annotator, replaces the left plot with Snorkel labeling function outputs - you can check labeling functions and your annotations against each other, or even directly apply those labeling function.
- 💡 one could also exploit labeling functions as sophisticated "filters" to help find interesting data points!

