


Dedicated, statistics-driven data analytics specialist offering diverse background in aviation, healthcare, technology, public service, and non-profit. Demonstrated strong organizational and creative problem-solving skills, adept communication abilities and unmatched adaptability. Effective at independently planning and managing diverse projects. Proficient in time management with disciplined execution strategy.
Key skills:
Excel, SQL, Tableau, PowerBI, R, RStudio, tidyverse, dplyr, ggplot, caret, tidymodels, plotly, python, pandas, scikit-learn (sklearn), spark, sparkML, sparklyR, pyspark

- This web app is created for resource planning use at a major Big 3 US airline.
- In order to gauge each airport's need for de-icing, heat watch, and other winter operations staffing and equipment, resource planning (RP) analysts needs to determine cold months at each airport.
- Some airports do not have dedicated weather stations, in which case RP analysts need to find a weather station that lies within the same geographical proximity.
- Programmatic calculation based on data from NOAA.
- Visualization of airports and weather station-specific datasets.
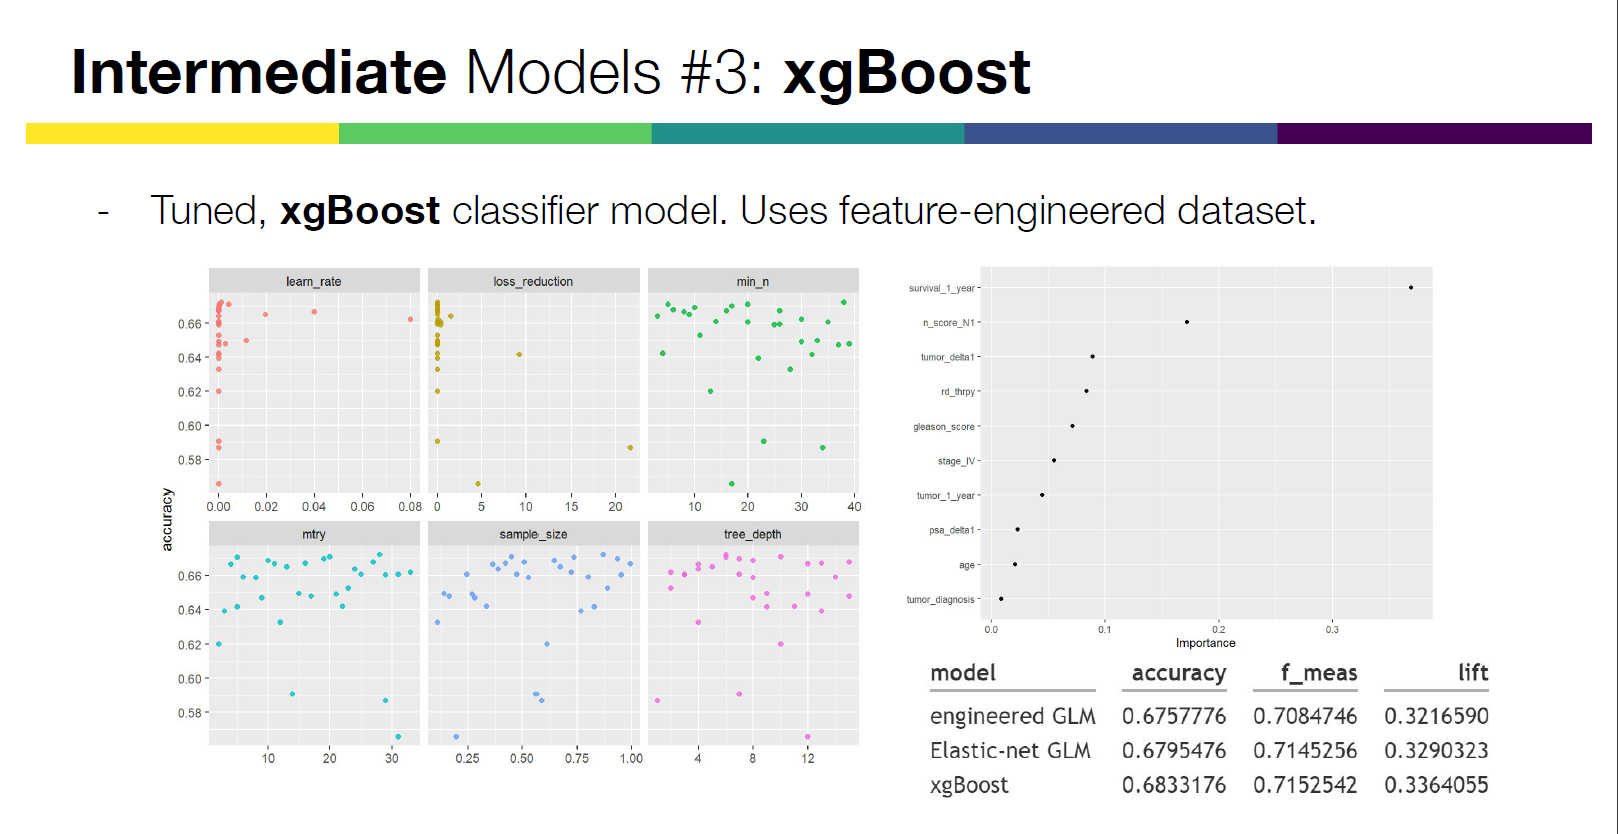
- This ML project and report is created as part of experiential learning at University of Illinois - Chicago, Liautaud Graduate Business School, course IDS.506 Healthcare Analytics.
- At diagnosis, healthcare providers need to gauge a patient's survivability to determine their needs for follow-up treatment timelines.
- Statistical machine learning methods combined with manual rule-based screens can provide a solid 33.6% predictive power uplift from null model.
- Model: Gradient-boosted random forest ensemble (xGBoost) + manual screening rule.
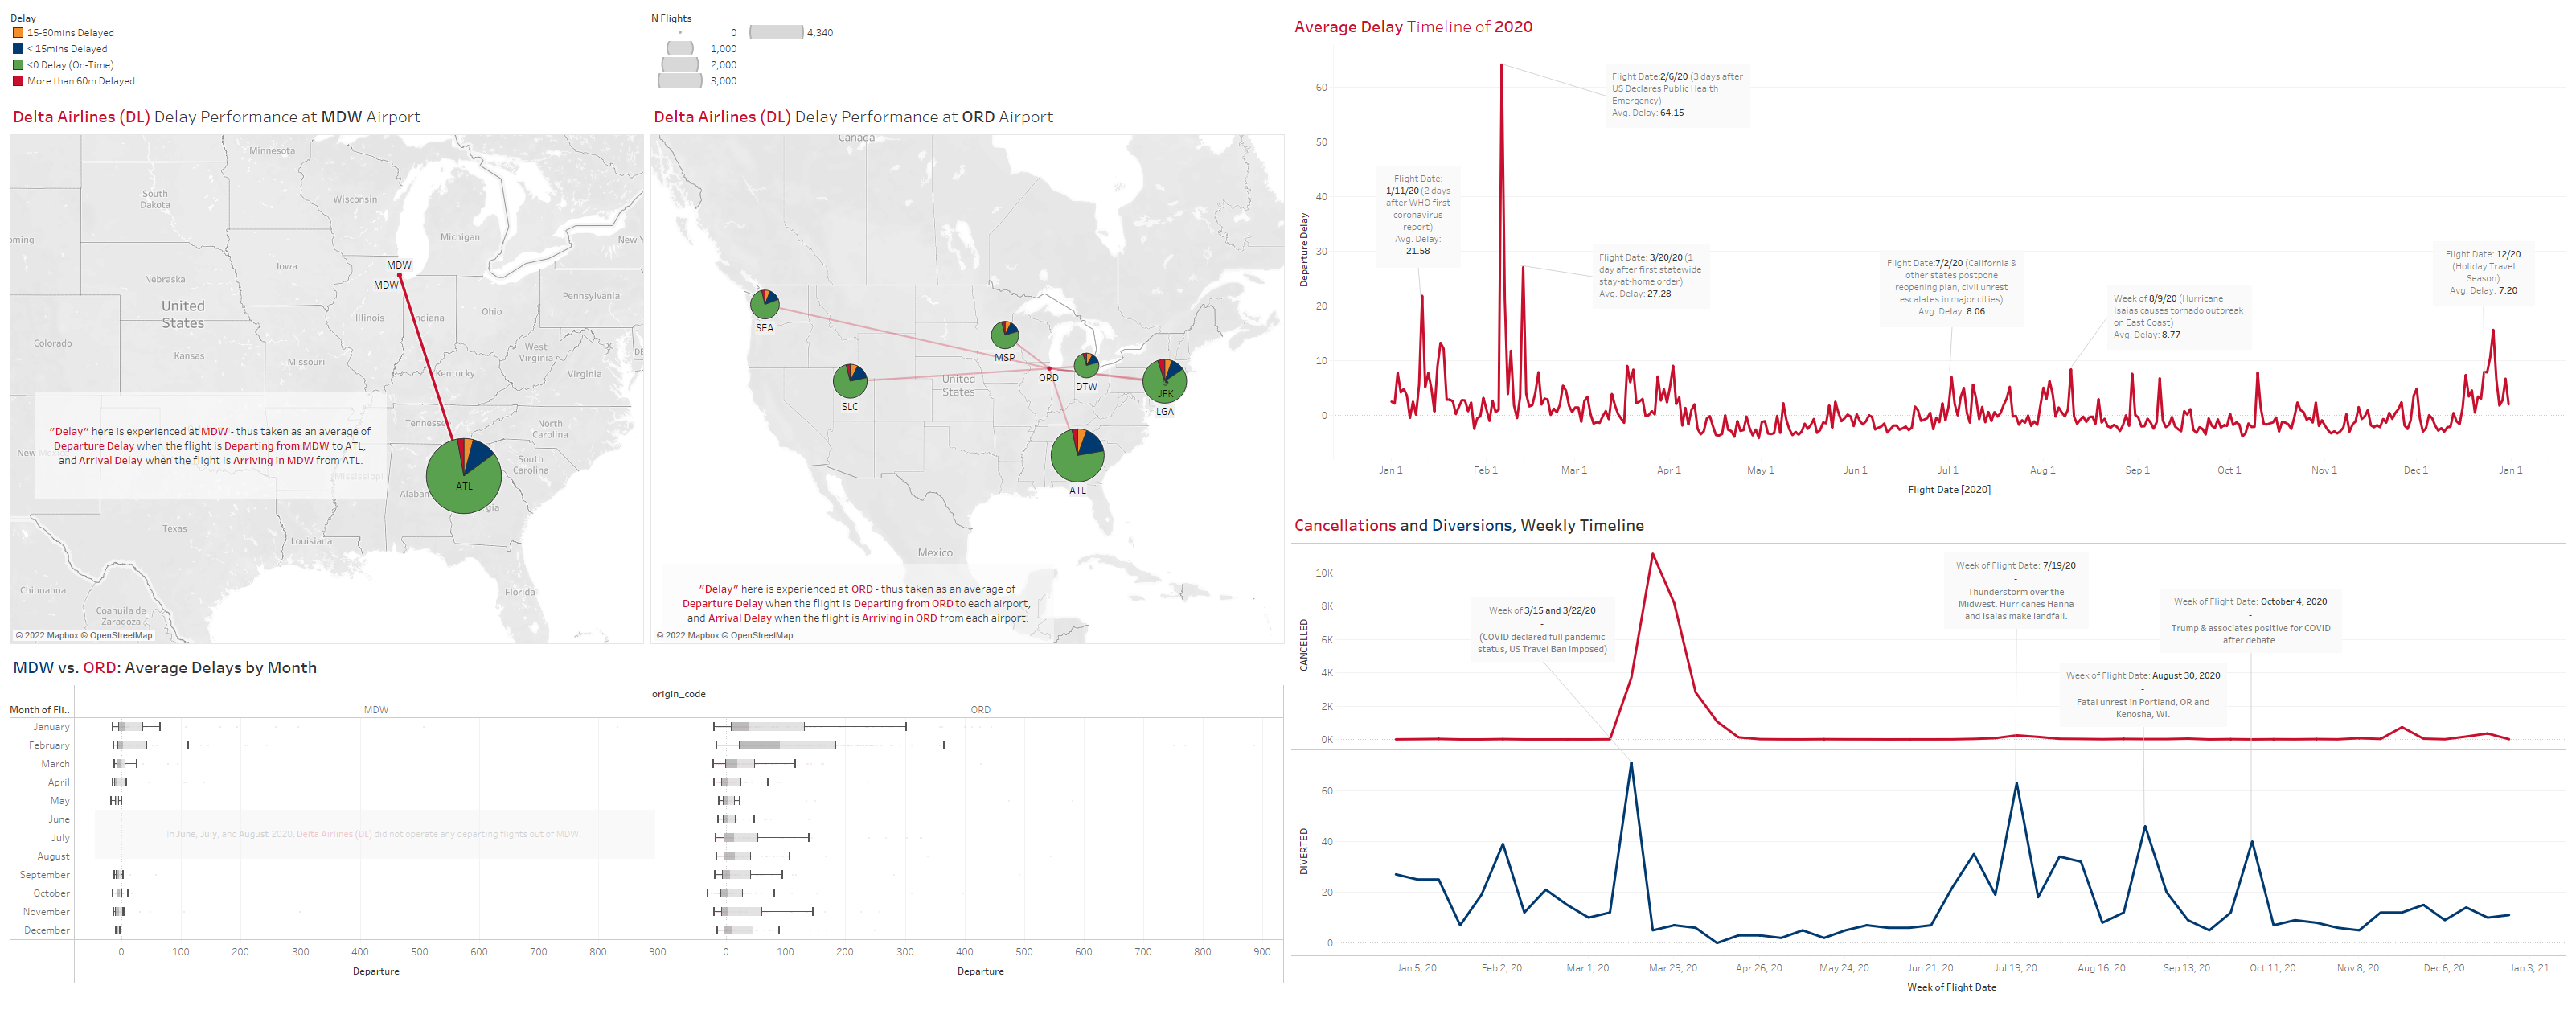
- This dashboard and report is created as part of experiential learning at University of Illinois - Chicago, Liautaud Graduate Business School, course IDS.561 Data Visualization.
- While delays have always been a significant challenge in airline passenger satisfaction, since 2020, airlines have suffered from massive and dynamic paradigm changes in the market, which in turn leads to worsening delay performance. Airline stakeholders in both network planning and operations need to be able to assess departure delay performance for future operations.
- Visual, interactive dashboard and storytelling with data for non-technical personnel through Tableau, allowing for quick and intuitive conveyance of information to key stakeholders.
- Note that in order to open .twbx Tableau file in repo, you will need to have a Tableau license.