Skip to content
New issue

Have a question about this project? Sign up for a free GitHub account to open an issue and contact its maintainers and the community.

By clicking “Sign up for GitHub”, you agree to our terms of service and privacy statement. We’ll occasionally send you account related emails.

Already on GitHub? Sign in to your account

Use tracing spans to trace the entire MIR interp stack #75143

Merged
merged 2 commits into from
Oct 4, 2020

Conversation

oli-obk
Copy link
Contributor

@oli-obk oli-obk commented Aug 4, 2020

r? @RalfJung

While being very verbose, this allows really good tracking of what's going on. While I considered schemes like the previous indenter that we had (which we could get by using the tracing-tree crate), this will break down horribly with things like multithreaded rustc. Instead, we can now use RUSTC_LOG to restrict the things being traced. You could specify a filter in a way that only shows the logging of a specific frame.

screenshot of command line output of the new formatting

If we lower the span's level to debug, then in info level logging we'd not see the frames, but in debug level we would see them. The filtering rules in tracing are super powerful, but I'm not sure if we can specify a filter so we do see debug level events, but not the frame spans. The documentation at https://docs.rs/tracing-subscriber/0.2.10/tracing_subscriber/struct.EnvFilter.html makes me think that we can only turn on things, not turn off things at a more precise level.

cc @hawkw

@rust-highfive rust-highfive added the S-waiting-on-review Status: Awaiting review from the assignee but also interested parties. label Aug 4, 2020
@davidbarsky
Copy link
Contributor

While I considered schemes like the previous indenter that we had (which we could get by using the tracing-tree crate), this will break down horribly with things like multithreaded rustc.

I think I can get tracing-tree to not be a nightmare when used with concurrent programs if I introduce a fine-grained, per-span (or per-span parentage hierarchy) locking behavior.

I also think it should be possible to get something that can be dynamically switched between tracing_subscriber::fmt::Layer and tracing_tree::Layer using the reload layer. I can talk a bit more about that, if you'd like.

@oli-obk
Copy link
Contributor Author

oli-obk commented Aug 4, 2020

Oh interesting! So we could turn on tracing-tree if we're running without concurrency (or when another flag is set that just disables it even without concurrency)?

locking behavior.

Uh, so... logs would not show until a thread is done with a span? So the entire span content would be buffered? That seems ok to me in most cases. We just need to turn all that off when debugging threading issues.

@Mark-Simulacrum
Copy link
Member

I think I would personally prefer that we not try to introduce locks or anything into rustc itself but rather have a separate tool that parses and re-shuffles logger output -- is that feasible? Too hard?

@hawkw
Copy link
Contributor

hawkw commented Aug 4, 2020

The filtering rules in tracing are super powerful, but I'm not sure if we can specify a filter so we do see debug level events, but not the frame spans. The documentation at https://docs.rs/tracing-subscriber/0.2.10/tracing_subscriber/struct.EnvFilter.html makes me think that we can only turn on things, not turn off things at a more precise level.

You should be able to use a filter like debug,[frame]=off (although I've not tried it). If that doesn't work, let me know — the filter implementation is quite complex and we're still trying to work out some of the kinks with more complex filtering.

@oli-obk
Copy link
Contributor Author

oli-obk commented Aug 4, 2020

is that feasible? Too hard?

I was considering that, too. Shouldn't be too hard to just prepend all log messages with a thread index (only if rustc is configured to use threads), then you can easily filter with just ripgrep.

@oli-obk
Copy link
Contributor Author

oli-obk commented Aug 4, 2020

If that doesn't work, let me know — the filter implementation is quite complex and we're still trying to work out some of the kinks with more complex filtering.

I tried RUSTC_LOG=rustc_mir::interpret=debug,[frame]=off, but I'm seeing frame{some::path::stuff} in the output (with the present PR, no other local changes)

@Mark-Simulacrum
Copy link
Member

rustc always uses threads for LLVM, at least, so it probably makes sense to just always include a thread ID.

@hawkw
Copy link
Contributor

hawkw commented Aug 4, 2020

If that doesn't work, let me know — the filter implementation is quite complex and we're still trying to work out some of the kinks with more complex filtering.

I tried RUSTC_LOG=rustc_mir::interpret=debug,[frame]=off, but I'm seeing frame{some::path::stuff} in the output (with the present PR, no other local changes)

Ugh, that's a bummer...I guess the "static" (target-based) filter takes priority. As I mentioned, the filtering code is pretty hairy...we need to make some changes so it behaves more reasonably with complex filters.

I was considering that, too. Shouldn't be too hard to just prepend all log messages with a thread index (only if rustc is configured to use threads), then you can easily filter with just ripgrep.

https://docs.rs/tracing-subscriber/0.2.10/tracing_subscriber/fmt/format/struct.Format.html#method.with_thread_ids :)

@davidbarsky
Copy link
Contributor

@oli-obk:

Oh interesting! So we could turn on tracing-tree if we're running without concurrency (or when another flag is set that just disables it even without concurrency)?

Maybe?

Uh, so... logs would not show until a thread is done with a span? So the entire span content would be buffered? That seems ok to me in most cases. We just need to turn all that off when debugging threading issues.

I think so!

@Mark-Simulacrum:

I think I would personally prefer that we not try to introduce locks or anything into rustc itself but rather have a separate tool that parses and re-shuffles logger output.

Fair enough, that's a good point!

is that feasible? Too hard?
I suppose there are a few options:

In either case, I'll hold off on any changes. Do you mind commenting on tokio-rs/tracing#884 with your needs and requirements?

@RalfJung
Copy link
Member

RalfJung commented Aug 5, 2020

So regarding this concrete PR, that's very interesting! But I feel like having the entire stacktrace on every line is way too verbose. Consider what this will look like in Miri where stacks are at least 10 frames high from the libstd start stuff, and can reach 50 frames easily.

But I agree that our traces could be made easier to read. Some random ideas:

  • Increase indentation by 2 for each frame, but in a way that actually helps. I know there is existing code for that but at least for Miri output I never visually "saw" this, it just wasn't helpful. I am not sure why. I think part of it is that Miri's logging is entirely separate from the core engine logging, and doesn't indent with it -- is that fixable with tracing?
  • Print the full stack trace occasionally. Like maybe each time it changes (function call/return)?

// we never enter or exit more spans than vice versa. Unless you `mem::leak`, then we
// can't protect the tracing stack, but that'll just lead to weird logging, no actual
// problems.
*self = Self(span);
Copy link
Member

Choose a reason for hiding this comment

The reason will be displayed to describe this comment to others. Learn more.

Wow this is super confusing and IMO needs more comments.^^

So the thing we do here is that SpanGuard calls "enter" on something in log::dispacher inside SpanGuard::enter, and it calls exit on drop. But we call the exit after the enter, and somehow it still works? And what if we create a SpanGaurd and never enter it, then we exit something that was never entered?

It doesn't help that Span is already something very different in rustc so my brain just makes all the wrong connections all the time.^^

Copy link
Contributor Author

Choose a reason for hiding this comment

The reason will be displayed to describe this comment to others. Learn more.

Yea, the ordering wasn't ideal (I changed it), but also technically irrelevant as enter never gets called twice, but if it were, this would be sane.

I documented all this on the new´ and enter` methods

src/librustc_mir/interpret/eval_context.rs Outdated Show resolved Hide resolved
@oli-obk
Copy link
Contributor Author

oli-obk commented Aug 6, 2020

I played around a bit with tracing-tree, what do you think of something like ? That doesn't repeat the current stack every now and then, but it makes it fairly easy to track. I could also add something at the closing of a span. This way we basically get back today's behaviour with the start/end logs of a stack frame, but we also have the tree structure

@RalfJung
Copy link
Member

RalfJung commented Aug 6, 2020

Hm... that looks promising yes. Is there some way to cap this so that when we have 70 nested frames we don't have a terminal full of vertical bars? Maybe after depth 50, reset to 0 and start over with the nesting or so?

@oli-obk
Copy link
Contributor Author

oli-obk commented Aug 6, 2020

Is there some way to cap this so that when we have 70 nested frames we don't have a terminal full of vertical bars? Maybe after depth 50, reset to 0 and start over with the nesting or so?

I'll have a look, that should be doable

@oli-obk
Copy link
Contributor Author

oli-obk commented Aug 6, 2020

Note that with the appropriate filters we can hide arbitrary levels. So we could set it up that the logs only start after a specific frame has been pushed and stop after that frame is popped. We'd could build a list of useful filters for ppl to pass to RUSTC_LOG.

@RalfJung RalfJung added S-waiting-on-author Status: This is awaiting some action (such as code changes or more information) from the author. and removed S-waiting-on-review Status: Awaiting review from the assignee but also interested parties. labels Aug 10, 2020
@oli-obk
Copy link
Contributor Author

oli-obk commented Aug 11, 2020

All the features discussed in this PR have been merged into tracing_tree, here's a picture of how the logs look with colors and other formatting:

Screenshot from 2020-08-11 12-21-42

In textual form:

2:rustc INFO rustc_mir::interpret::eval_context PAUSING
2:rustcrustc_mir::interpret::eval_context::frame{message=unwind::libunwind::_Unwind_Exception::private::{{constant}}#0}
2:rustc├─0ms  INFO rustc_mir::interpret::eval_context ENTERING
2:rustc├─0ms  INFO rustc_mir::interpret::step _0 = const unwind::libunwind::unwinder_private_data_size
2:rustc├─0ms  INFO rustc_mir::interpret::eval_context PAUSING
2:rustc├─rustc_mir::interpret::eval_context::frame{message=unwind::libunwind::unwinder_private_data_size}
2:rustc│ ├─0ms  INFO rustc_mir::interpret::eval_context ENTERING
2:rustc│ ├─0ms  INFO rustc_mir::interpret::step _0 = const 6_usize
2:rustc│ ├─0ms  INFO rustc_mir::interpret::step return
2:rustc│ ├─0ms  INFO rustc_mir::interpret::eval_context LEAVING(0) unwind::libunwind::unwinder_private_data_size (unwinding = false)
2:rustc├─0ms  INFO rustc_mir::interpret::step return
2:rustc├─0ms  INFO rustc_mir::interpret::eval_context LEAVING(0) unwind::libunwind::_Unwind_Exception::private::{{constant}}#0 (unwinding = false)

@oli-obk oli-obk added S-waiting-on-review Status: Awaiting review from the assignee but also interested parties. and removed S-waiting-on-author Status: This is awaiting some action (such as code changes or more information) from the author. labels Aug 11, 2020
@RalfJung
Copy link
Member

I like that rendering, except for this part

rustc_mir::interpret::eval_context::frame{message=unwind::libunwind::unwinder_private_data_size}

Is there any way to make the function name more prominent here? I feel it drowns a bit in the noise, with the {message=...} around it.

Also the ENTERING is rather redundant, isn't it? (LEAVING is nice because it repeats the function name.)

@RalfJung
Copy link
Member

Also PAUSING doesnt have the function name any more (not sure why) and looks very different than the other messages? It has no timing and the "INFO" is before the module instzad of after.

And what about CONTINUING?

@RalfJung
Copy link
Member

Also my question is still open of how this looks like in Miri, when there are also Miri log messages between the core engine log messages.

@oli-obk
Copy link
Contributor Author

oli-obk commented Aug 12, 2020

with the {message=...} around it.

oops, I didn't notice that. I'm gonna remove all that. This wrapping isn't necessary for hierarchical printing

@oli-obk
Copy link
Contributor Author

oli-obk commented Sep 28, 2020

Ideally with an extra marker for whenever basic::server is repeated, indicating that this is not a new thing but a repetition of old data.

The extra marker is ;)

If you come up with better symbols, I'm very open to other things, but I'd rather get something merged and bikeshed symbols in the tracing-tree bugtracker

@RalfJung
Copy link
Member

If you come up with better symbols, I'm very open to other things, but I'd rather get something merged and bikeshed symbols in the tracing-tree bugtracker

Sure.

@davidbarsky
Copy link
Contributor

This is now just waiting on davidbarsky/tracing-tree#19 getting merged and @davidbarsky publishing a new version after that.

Sorry about that! Totally slipped my mind—I read the notification on GitHub and left it in my tabs. Taking care of that now; I'll update y'all when I publish a new version in about 30 minutes.

@oli-obk
Copy link
Contributor Author

oli-obk commented Sep 28, 2020

No worries! Thanks for taking care of it now.

@davidbarsky
Copy link
Contributor

@oli-obk
Copy link
Contributor Author

oli-obk commented Sep 28, 2020

New output:
Screenshot from 2020-09-28 20-07-03

@RalfJung
Copy link
Member

Yes that rendering looks great. :)

self.frame().instance,
unwinding
);
info!(unwinding);
Copy link
Member

Choose a reason for hiding this comment

The reason will be displayed to describe this comment to others. Learn more.

Why is info!(unwinding) run twice? Also just having unwinding=true/false in the log without much context is not very clear...

Copy link
Contributor Author

Choose a reason for hiding this comment

The reason will be displayed to describe this comment to others. Learn more.

The duplication is gone, and we now inform about the stack popping again

Ooh, maybe we should try out #[instrument] next 😆

Copy link
Member

Choose a reason for hiding this comment

The reason will be displayed to describe this comment to others. Learn more.

Ooh, maybe we should try out #[instrument] next laughing

No idea what that means.^^

@RalfJung
Copy link
Member

RalfJung commented Oct 3, 2020

@bors r+

@bors
Copy link
Contributor

bors commented Oct 3, 2020

📌 Commit 8f9472c has been approved by RalfJung

@bors bors added S-waiting-on-bors Status: Waiting on bors to run and complete tests. Bors will change the label on completion. and removed S-waiting-on-author Status: This is awaiting some action (such as code changes or more information) from the author. labels Oct 3, 2020
Dylan-DPC-zz pushed a commit to Dylan-DPC-zz/rust that referenced this pull request Oct 3, 2020
Use `tracing` spans to trace the entire MIR interp stack

r? @RalfJung

While being very verbose, this allows really good tracking of what's going on. While I considered schemes like the previous indenter that we had (which we could get by using the `tracing-tree` crate), this will break down horribly with things like multithreaded rustc. Instead, we can now use `RUSTC_LOG` to restrict the things being traced. You could specify a filter in a way that only shows the logging of a specific frame.

![screenshot of command line output of the new formatting](https://user-images.githubusercontent.com/332036/89291343-aa40de00-d65a-11ea-9f6c-ea06c1806327.png)

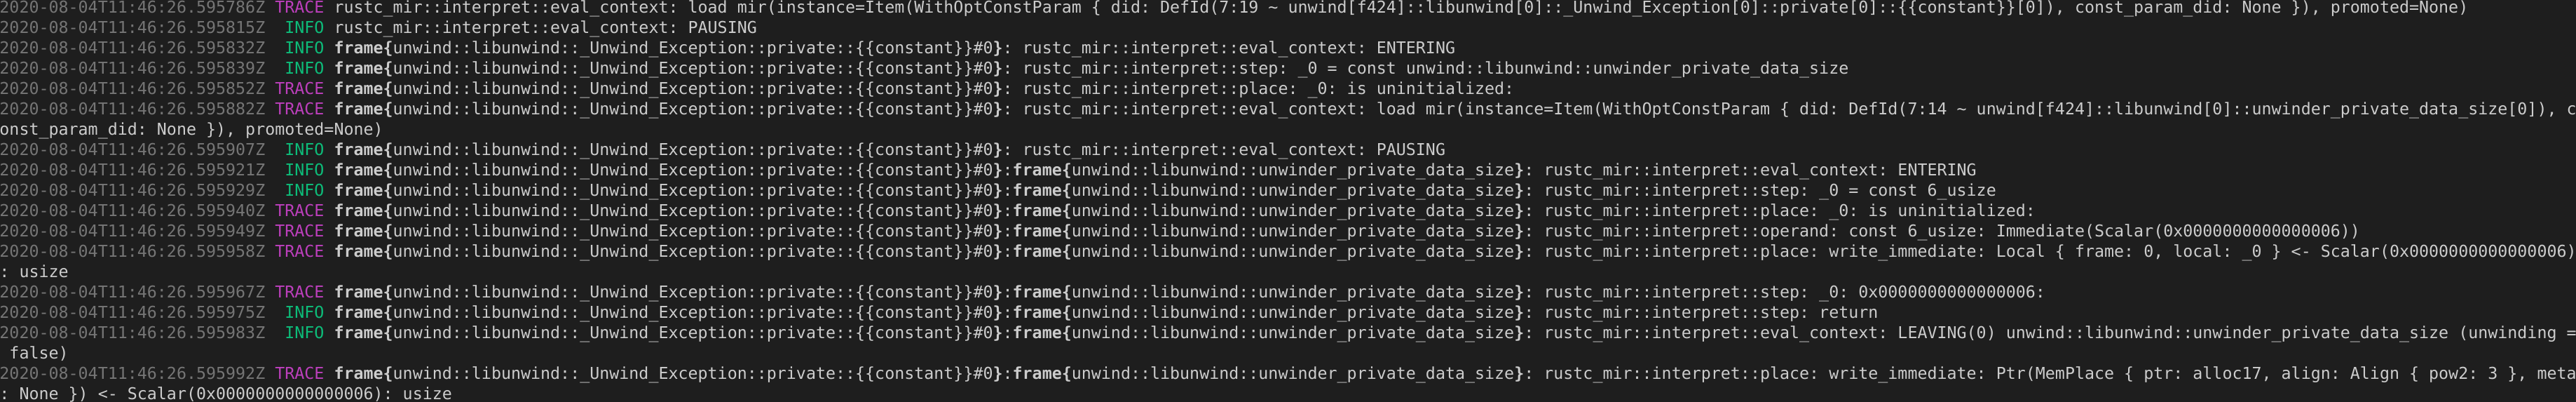
If we lower the span's level to `debug`, then in `info` level logging we'd not see the frames, but in `debug` level we would see them. The filtering rules in `tracing` are super powerful, but  I'm not sure if we can specify a filter so we do see `debug` level events, but *not* the `frame` spans. The documentation at https://docs.rs/tracing-subscriber/0.2.10/tracing_subscriber/struct.EnvFilter.html makes me think that we can only turn on things, not turn off things at a more precise level.

cc @hawkw
bors added a commit to rust-lang-ci/rust that referenced this pull request Oct 4, 2020
Rollup of 11 pull requests

Successful merges:

 - rust-lang#75143 (Use `tracing` spans to trace the entire MIR interp stack)
 - rust-lang#75699 (Uplift drop-bounds lint from clippy)
 - rust-lang#76768 (Test and reject out-of-bounds shuffle vectors)
 - rust-lang#77190 (updated p! macro to accept literals)
 - rust-lang#77388 (Add some regression tests)
 - rust-lang#77419 (Create E0777 error code for invalid argument in derive)
 - rust-lang#77447 (BTreeMap: document DrainFilterInner better)
 - rust-lang#77468 (Fix test name)
 - rust-lang#77469 (Improve rustdoc error for failed intra-doc link resolution)
 - rust-lang#77473 (Make --all-targets in x.py check opt-in)
 - rust-lang#77508 (Fix capitalization in blog post name)

Failed merges:

r? `@ghost`
@bors bors merged commit 6e25418 into rust-lang:master Oct 4, 2020
@rustbot rustbot added this to the 1.49.0 milestone Oct 4, 2020
@oli-obk oli-obk deleted the tracing branch October 5, 2020 08:16
Dylan-DPC added a commit to Dylan-DPC/rust that referenced this pull request May 11, 2022
…-obk

logging: add env var to control verbose scope entry/exit logging

~~This got removed in rust-lang#75143, and I find this makes long traces a lot harder to read, so I propose we add this back.~~

Example trace:
```
│ │ ├─0ms  INFO rustc_const_eval::interpret::step return
│ │ ├─0ms  INFO rustc_const_eval::interpret::eval_context popping stack frame (returning from function)
│ │┌┘rustc_const_eval::interpret::eval_context::frame std::ptr::mut_ptr::<impl *mut u8>::guaranteed_eq
│ ├┘rustc_const_eval::interpret::eval_context::frame std::ptr::mut_ptr::<impl *mut u8>::is_null
│ ├─1ms  INFO rustc_const_eval::interpret::step // executing bb2
│ ├─1ms  INFO rustc_const_eval::interpret::step StorageDead(_4)
│ ├─1ms  INFO rustc_const_eval::interpret::step StorageDead(_2)
│ ├─1ms  INFO rustc_const_eval::interpret::step return
│ ├─1ms  INFO rustc_const_eval::interpret::eval_context popping stack frame (returning from function)
│┌┘rustc_const_eval::interpret::eval_context::frame std::ptr::mut_ptr::<impl *mut u8>::is_null
├┘rustc_const_eval::interpret::eval_context::frame std::sys_common::thread_local_dtor::register_dtor_fallback::run_dtors
├─178ms  INFO rustc_const_eval::interpret::step // executing bb2
├─178ms  INFO rustc_const_eval::interpret::step StorageDead(_5)

```

r? `@oli-obk`
Sign up for free to join this conversation on GitHub. Already have an account? Sign in to comment
Labels
S-waiting-on-bors Status: Waiting on bors to run and complete tests. Bors will change the label on completion.
Projects
None yet
Development

Successfully merging this pull request may close these issues.

10 participants