CAT Tutorial
This tutorial goes through the process of creating a computer adaptive test. This tutorial assumes basic knowledge of item response theory and computer adaptive testing.
In this guide we’re going to:
- upload an item bank using a Flat Table
- create a data table in which to store responses to our items
- create the test format for our CAT
- set an item-limit for test execution
- set the scoring properties of the test
- present a feedback page showing the score and feedback
- Download Item Bank
- Download Demo CAT test as .yml (v5.0.20)
Under the Data Tables tab, click on starter content. Find assessmentFlatItems and edit to open. Create a copy of it and give it a new name (e.g. ‘CATexampleFlatItems’).

Download this data table to a .csv and input your items into it. Make sure to save your item bank file with UTF-8 Encoding. Flat Item table tutorial.

Once your item bank is ready, upload it to your data table, checking ‘Header row’. This will mean you have your own items in a Flat table.

You can use the default assessmentResponses table to store responses to your CAT, if you want to. However in this case we will create a new table. Under the Data Tables tab, make a copy of the assessmentResponses table.


Give your new responses table a name (e.g. CATexampleResponses) under “Name of the new object” and click “save”; this creates a new data table that we can later tell our assessment node to use for storing the test responses.
Go to the Test tab and create a new test. We want to add an intro page to our test, so right click to add a showPage node.

Fill in the Title and Content. This may include a brief overview of the test, terms and conditions and/or instructions. Save the changes to return to the test flowchart page.

Using right click again, create an assessment node. In the items tab, set Type to Flat table. This tells the node to expect items in the flat table format. Set Order to CAT, which tells the assessment node to use the CAT algorithms. After an item is answered, the node will use the IRT parameters in your flat item table, and the CAT settings you have specified, to calculate the individual’s theta score and the standard error of measurement and choose the next item accordingly.

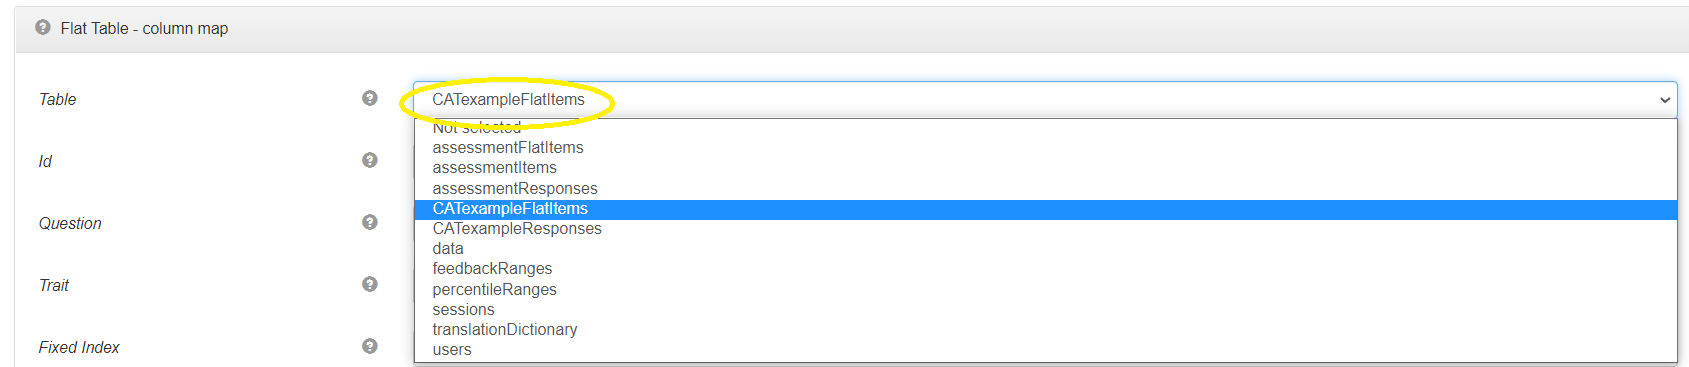
Click the Edit icon under Flat Table and choose the data table you created that contains your items (e.g. CATexampleFlatItems).
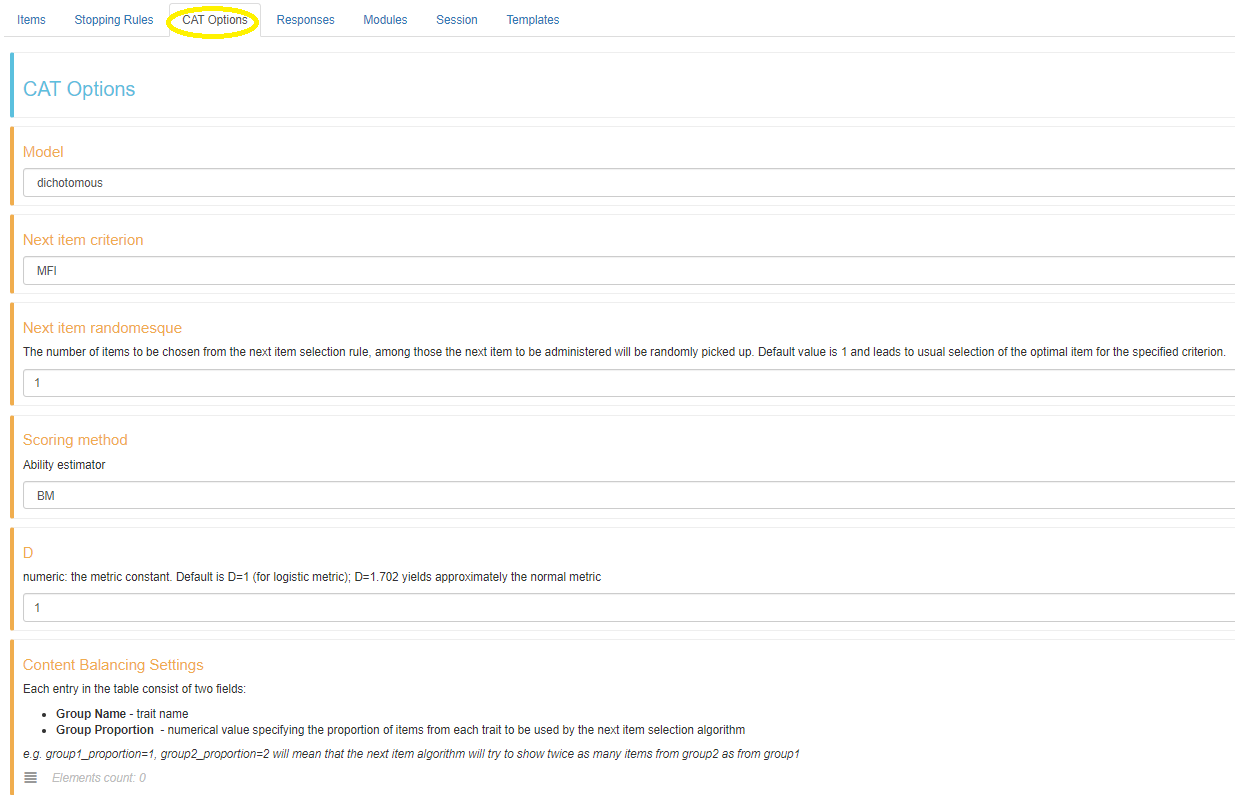
There are many settings in the CAT Options tab which you can use to customise how your CAT works. In this case we will just leave the settings to use the default.
Under the Stopping Rules tab, we can limit either the time allowed for each item or test, or restrict the test to a certain number of items, to prevent the test from taking too long. It must be noted that the shorter the test time or less items answered, then the less accurate the test is likely to be. Here, for this tutorial, we will “Limit Number of Items” to 4. This means that after answering 4 questions, the test will finish and a score will be calculated from the items answered by the participant.

Under the Responses tab, select the following:
- “Require responses” ensures that an individual cannot skip a question. This is optional.
- Under “Response Bank” set the first option, “Table”, to the data table you created for storing responses (e.g. CATexampleResponses).
- “Calculate theta”: Theta is used to represent the ability of an individual.
- “Calculate SEM”: SEM is the standard error measurement.

Under the Templates tab, you can optionally tell the test to show a title, and other visual elements such as the instructions field (which can also be set from the ‘instructions’ column of your flat item table).

Also, make sure that “Show page info” is not selected. This prevents page numbers being shown, which is normally a good idea with CAT since the exact length of the test is not known in advance.

Save all settings to return to the flow chart test structure.
There are multiple ways to score the test. I will explain two possible ways. The first involves using the raw Theta and SEM scores, whereas the second involves adding a scoring node to calculate the score. For both methods you need to create a showPage node by right clicking and selecting the showPage option. This is where feedback or scores will be relayed to the participant.
On the assessment node click the red cross and under “Exposed returns” select “sem” and “theta”. Note that if your CAT is measuring multiple traits, you can expose the traitTheta and traitSEM return ports to get a R list object containing key-value pairs of the theta and SEM scores for all traits. You can then filter these list objects as needed.

On the showPage node click the blue cross and under “Dynamic input” add “theta” and “sem” separately.

Then connect the “sem” and “theta” nodes on the assessment node and the showPage nodes.

On the showPage node we’re going to enter the Content we want to show on the showPage instance:
Thank you for participating in the test. Your scores are as follows:
Theta: {{theta}}
SEM: {{sem}}Instead of using the Theta and Sem scoring described above, we could also use a scoring node to transform the score into a different format. On the test flow chart page, right click and add a Scoring node between the assessment and showPage nodes.
On the assessment node, click the red cross and under “Exposed returns” select “theta” as mentioned previously.

Open the scoring node. Under Score Type there are different ways of transforming the score. We will use the IQ scoring type. Set “Mean” to 0 and “Standard Deviation” to 1.

The feedback tab of the scoring node allows you to specify the feedback to be given. If you choose to provide feedback, such as by using ranges of scores, then you will need to create a further output from this node for feedback. However, for this tutorial we will use the default of “No feedback”. Save the settings to return to the flowchart test structure.
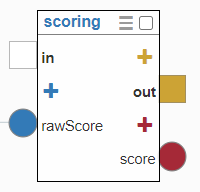
On the scoring node, check the blue plus sign and under “Exposed inputs” select rawScore.

Connect the assessment node theta output to the scoring node rawScore input.

Then on the scoring node add an output by selecting the red plus sign and select “score” under “exposed returns”.
Also, add an input (by clicking the blue plus sign) on the showPage node and under “Dynamic input” add “IQ” and save.

Connect the score output of the scoring node with the IQ input on the showPage.

The score on the output page will be to a high degree of accuracy (to multiple decimal places) so to round the score, click on the link between the score output and IQ input and change the code to 1 decimal place:
round(score,1)
On the showPage node, fill in the Title of the test and under Content HTML section you can write comments and return the participants score by writing:
Thank you for completing the test.
Your estimated score is {{IQ}}.
Note: Depending on which scoring method you use and the name of it, you return the scores as follows: {{score}}
The Button Label text may be deleted as this is the final page of the test.
Connect together the different nodes to get a complete test. The test using the IQ scoring system would look as follows:

You have now completed a full test! You can then run your test to check it works. After running the test a few times, you can also check the data table to see how the data is saved.