Handle User Inputted Data
Communication with user is done by showing pages during the test. Any given page can have numerous inputs that a user can fill and submit with the page, and the values of these inputs will be available in your test logic once submitred.
By default, a page in a Concerto test will be submitted when:
- a button is clicked (unless the button has the CSS class concerto-nosubmit)
- the time limit for the template has run out
It is also possible to run Javascript before submitting the page.
Along with the values inputted by the user, the following data will be sent by Concerto to to your test logic:
- buttonPressed – name of the button pressed that initiated submit; timeout in the case when page is submitted automatically when time runs out
- timeTaken – how long the user spent on the page (in seconds)
- retryTimeTaken – how long the user spent on the page (approximation, in seconds) waiting for his internet connection to be functional again
- isTimeout – 1 when page was submitted because of the time limit running out, 0 otherwise
This guide will demonstrate how you can get user input from a showPage node. There are two ways of doing so:
- exposing response return variable
- creating dynamic ports
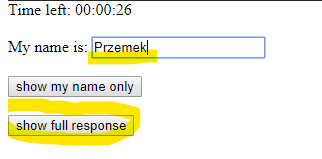
- Show page asking for input
Let’s start with adding showPage node to our flow. Right click on your flowchart and select showPage to add it.
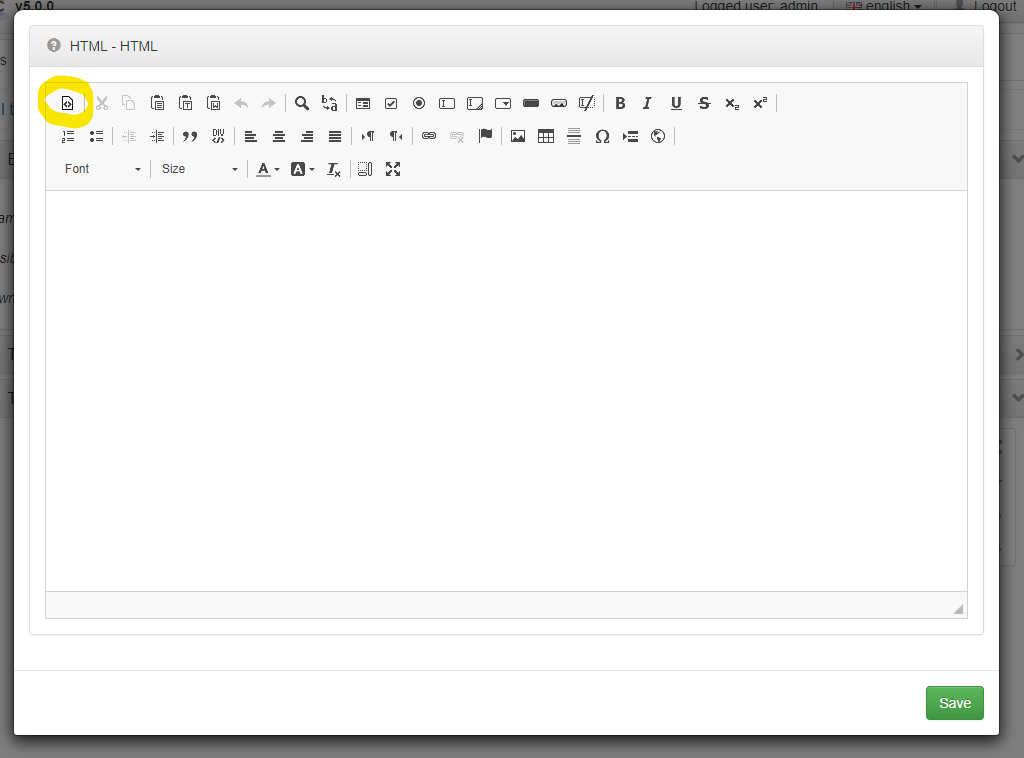
Here we are going to set the HTML property in source mode. Of course you can do the same using visual editor. To switch HTML editor to source mode, click the button highlighted below.
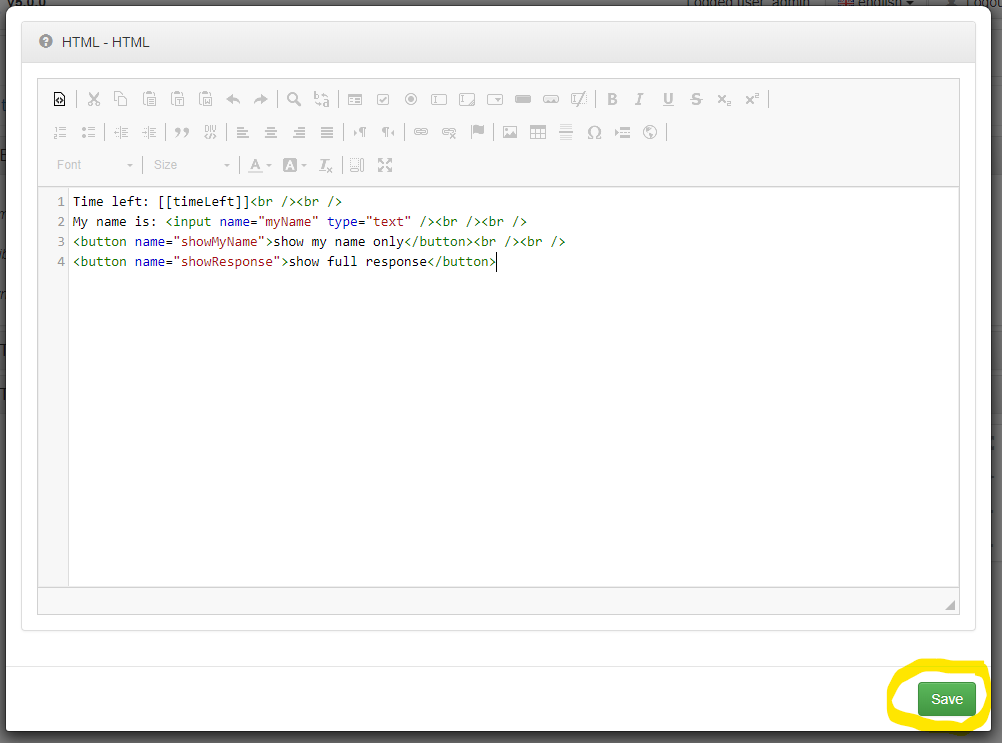
Enter the following HTML code for your page:
Time left: [[timeLeft]]<br /><br />
My name is: <input name="myName" type="text" /><br /><br />
<button name="showMyName">show my name only</button><br /><br />
<button name="showResponse">show full response</button>
Let’s see what we have here. Starting from the top:
Time left: [[timeLeft]]<br /><br />
This line is responsible for showing the page timer. Note that it is not using curly double brackets {{x}}. Instead it uses square double brarackets x. The difference is that curly double brackets are used to insert template parameters (originating from R test logic), whereas square double brackets insert variables that originate client side (javascript, AngularJS).
My name is: <input name="myName" type="text" /><br /><br />
Here we have a text input. The value set by the user will be sent to our test logic when the page is submitted. The important thing to notice here is the name attribute. We will use this to reference the variable later on in our test logic.
<button name="showMyName">show my name only</button><br /><br />
This is the first of our buttons. As mentioned earlier, buttons will submit the page, sending user input to our test logic. The name attribute here is also important, as one of the variables sent back will be buttonPressed and the value of that variable will be the name of the button that submitted the page. This information can be used to determine test flow, for example where the test-taker clicks different buttons to go to different tests, or different parts of the same test.
<button name="showResponse">show full response</button>
Second button.
Make sure that your HTML code looks the same as the example below and click Save.
- Set page time limit
Set Time limit property to 30 and click Save. This will set a 30 second time limit after which the page will be submitted automatically.

- Set execution branches
We can use dynamic branch ports on the showPage node to route the execution flow in different directions depending on which button has been pressed. On page submit, the dynamic branch port with the same name as the name attribute of the button pressed will be selected. If the page time limit runs out, the value of buttonPressed variable is set to timeout, which means we can also use that for our branch name. In this case you can hide the default out branch, as we won’t need it. Instead, add the following dynamic branches:
- showMyName
- showResponse
- timeout
Notice that the first two branch names match exactly the name attributes of the buttons on our page.
Your showPage node should now look like this.

- Expose data ports
All native data ports are hidden by default to avoid cluttering your flowchart. Since we want to show what the native response return variable of the showPage node looks like, we need to expose it.
Click the red plus icon on the right side of the showPage node to expose the native ports.

Check the response port checkbox, to mark it to be exposed and click Save.

Your node should now look like this.

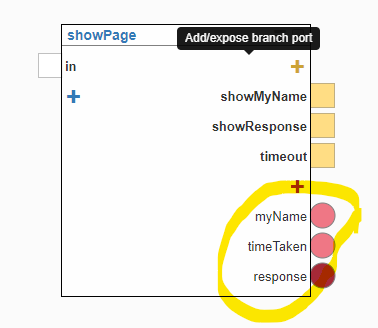
Now let’s add three dynamic return ports:
- myName
- timeTaken
Notice that myName matches exactly the name attribute of the text input we have on our page. The showPage node will set the values of any dynamic return ports to the value of matching elements from the response list.
Our node should now look like this.
- Logging
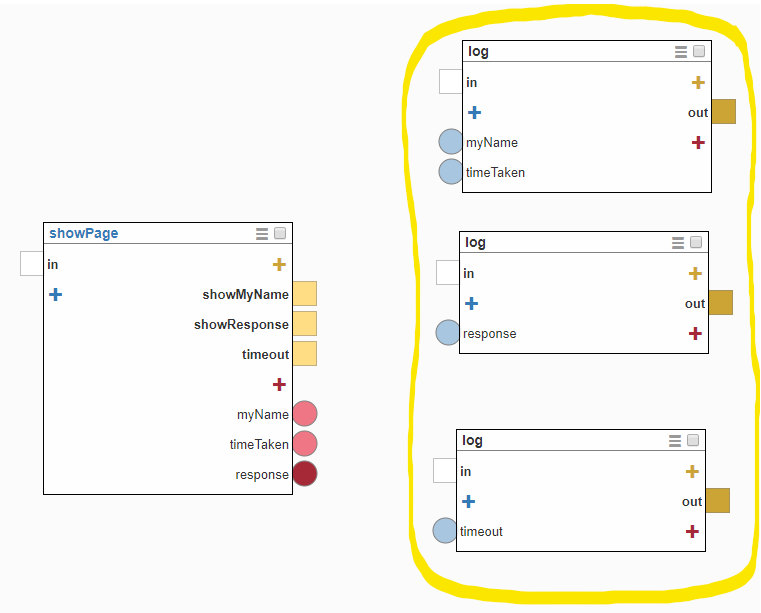
Let’s add three log nodes to test out our work. The log node will take all dynamic inputs passed to it and print out a string representation of their values, with an added timestamp. As with all test logic output, you can see it in your browser console, by running the test in debug mode.
The first log node will be responsible for printing out the data entered by user in the myName field and the length of time it took for the user to submit the page (timeTaken).
The second one will print out the full response, using the native response return port of the showPage node, which we just exposed.
The third one will inform us when we have run out of time.
This is how your flow should look by now:
- Flow connections
Let’s connect it all now. Remember to save your work. When done it should look like this:

Click Debug test.
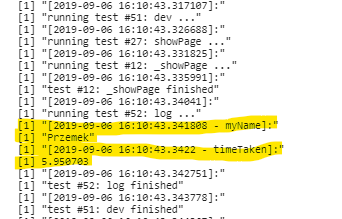
- showMyName branch
First, let’s enter your name and click show my name only button.

Check your browser console. You should see something like this:
- showResponse branch
Run the test in Debug mode again, or refresh your browser window. Enter your name again, but this time click on show full response
Check your browser console. You should see something like this:

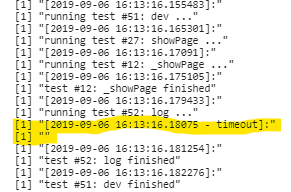
- timeout branch
Restart your test again. This time do nothing. Let the timer run out. When done, check your browser console. You should see the timeout message as below. Well done!