Ipsative Test Tutorial
This tutorial demonstrates the process of creating a simple ipsative test (sometimes known as a forced-choice test). Basic knowledge of psychometrics is assumed, alongside an awareness of how basic Concerto features may be adapted to suit your specific test.
In this guide we’re going to:
- Create and upload an item bank using a Flat Table
- Create a data table in which to store responses to our items
- Create our ipsative test using the flowchart nodes
- Understand how to score a multi-trait/ multi-factor ipsative test
- Present a feedback page showing the score and feedback
- Download Item Bank as .csv
- Download Ipsative Test as .yml (v5.0.20)
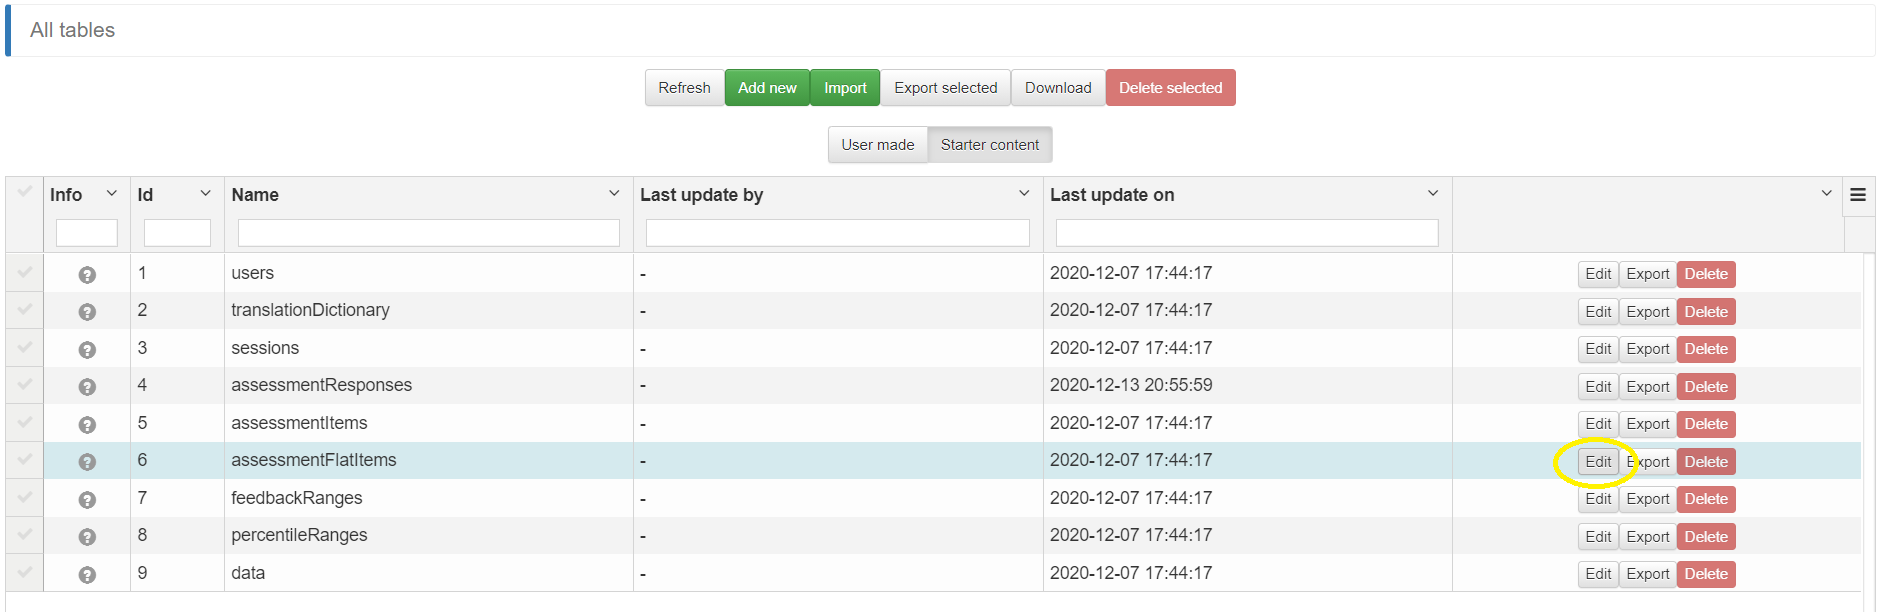
Under the Data Tables tab, click on starter content. Find assessmentFlatItems and edit to open. Create a copy of it and give it a new name (e.g. ‘ipsativeFlatItems’).
Download this data table to a .csv and input your items. Make sure to save your item bank file with UTF-8 Encoding. Flat Item table tutorial..
The kind of ipsative test we are going to make here is one where individuals are given a limited number of response options and have to select the response that most represents them. In this case, a score of one is assigned for each response option, but each response option represents a different factor/ trait. Therefore, the different columns would be filled out as followed:
- responseLabelN: Each label should be a unique response option. For example, responseLabel1 should contain the text to show on the button for the first response option
- responseValueN: What value to save to the database for a given response option. For example, this might be a numeric representation of the response.
- responseScoreN: Numeric score value of the response option. For example, if a score of “1” is assigned then it means that if an individual picks this option, a score of 1 will be recorded for the trait to which that response option belongs
- responseTraitN: Each response may measure a different trait or factor; ensure the correct trait is assigned to each response option.
Once your item bank is ready, upload it to your data table, checking ‘Header row’. This will mean you have your own items in a Flat table.

Note: The default Flat table has four response options. If you want more or fewer (e.g. 3 or 5) you can delete or add to the four response columns mentioned previously. Remember that the structure of the csv you are uploading needs to match the structure of the data table. Therefore if you’re adding columns, for example, remember to add them to the data table before you upload your file. Clicking ‘Restructure’ is not recommended because it will overwrite the format settings of your data columns (i.e. change them to text).
You can use the default assessmentResponses table to store responses to your test, if you want to. However, in this case we will create a new table. Under the Data Tables tab, make a copy of the assessmentResponses table.


Give your new responses table a name (e.g. ipsativeResponses) under “Name of the new object” and click “save”; this creates a new data table that we can later tell our assessment node to use for storing the test responses.
If you wish to store already calculated trait scores as you go, you may choose to create a separate data table to store the trait scores separately from the individual item responses; this can be helpful for the scoring and feedback. To do this, find the starter content “data” table , copy it and save under a new name (e.g. “ipsativedata”).
Go to the Test tab and create a new test.
Right click to create an assessment node.

In the items tab, set Type to Flat table. This tells the node to expect items in the flat table format.
Set Order to Random, which tells the assessment node to show the items in a random order.

Click the Edit icon under Flat Table and choose the data table you created that contains your items (e.g. ipsativeFlatItems).

There are many settings with which to customise how the test works. In this case we will just leave the settings under the ‘CAT Options’ tab as default. Under the ‘Stopping Rules’ tab you can limit the number of items or time taken for the test. However, we will leave these as default for the purpose of this test; all items will be administered.
Under the Responses tab, select the following:
- “Require responses” ensures that an individual cannot skip a question. This is optional.
- Under “Response Bank” set the first option, “Table”, to the data table you created for storing responses (e.g. ipsativeResponses).

Under the Templates tab, you can optionally tell the test to show a title, and other visual elements such as the instructions field (which can also be set from the ‘instructions’ column of your flat item table). Also, the “Show page info” enables the pages to be numbered which shows the test-taker how many pages they have to complete the test. You can uncheck this if your test is an ipsative CAT.
Save all settings to return to the flow chart test structure.
There are multiple ways to score the test.
On the assessment node click the red cross and under “Exposed returns” select “traitScores”.

Back in the flow chart test structure right click to insert a saveData node.

Open the saveData node and select the “Table” to save your data in (e.g. ipsativedata). Save to return to the flow chart test structure.

On the saveData node click the blue cross and under “Exposed input” add “data”.

Connect the assessment node’s “traitScores” to the saveData node’s “data” input. This saves the trait scores from the test in the separate data table, which can be helpful for later analysis or feedback.

Right-click to add a showPage node. This is where feedback or scores will be relayed to the participant.
For this tutorial, our ipsative items were based on the Big Five personality traits, so “responseTraits” were assigned values of “O” for openness, “C” for conscientiousness, “E” for extraversion, “A” for agreeableness and “N” for neuroticism. So, to provide individual response trait scores, on the showPage node, add five “Dynamic inputs” to your showPage node (by clicking the blue left cross). Call them “O”, “C”, “E”, “A”, “N”.


Make sure that each input has an initial default score of zero. To do this, click on the input letter on the showPage node. Set the “Default value” as “0” and select the “Default value as text” box.

Open the showPage node, fill in the Title of the test and under “Content” you can present the feedback using code like the following:
Your scores are:
Openness: {{O}}
Conscientiousness: {{C}}
Extraversion: {{E}}
Agreeableness: {{A}}
Neuroticism: {{N}}
The Button Label text may be deleted as this is the final page of the test.

The traitScores output on the assessment node contains an R list object with calculated total scores for all traits in the responseTrait column of your item table. We can use this object and filter it in order to obtain the separate trait scores. Connect the “traitScores” on the assessment node to the five individual trait inputs on the showPage node. On the connections, click the hamburger icon to assign the correct trait scores to each trait. For example, for agreeableness (A), write
traitScores$A
Repeat this labelling for the other traits.

In this format, the saveData node is merely for saving the trait scores in a separate data table for analysis. However, further amendments may be made by adding a scoring node following the saveData node. The trait scores can then be linked to different feedback statements. There is a separate tutorial on adding feedback to tests.
Finally, connect together the execution flow of all the nodes to get a complete test:

You have now made an ipsative test! After running the test a few times, you can also check the data table to see how the data is saved.
It must be noted that this tutorial test is useful for within-persons analysis as it will tell you which of the traits/ factors a given participant is stronger in compared to the other factors. However, it is less helpful in between-persons analysis (i.e. comparing one individual against another) without using more complex scoring methods.